
![]()
Description: This tutorial is an introduction to FIWARE STH-Comet - a generic enabler which is used to retrieve trend data from a MongoDB database. The tutorial activates the IoT sensors connected in the previous tutorial and persists measurements from those sensors into a database and retrieves time-based aggregations of that data.
The tutorial uses cUrl commands throughout, but is also available as Postman documentation

![]()
Querying Time Series Data (MongoDB)
"The "moment" has no yesterday or tomorrow. It is not the result of thought and therefore has no time."
— Bruce Lee
Within the FIWARE platform, historical context data can be persisted to a database (such as MongoDB) using a combination of the Orion Context Broker and the Cygnus generic enabler. This results in a series of data points being written to the database of your choice. Each time-stamped data point represents the state of context entities at a given moment in time. The individual data points are relatively meaningless on their own, it is only through combining a series data points that meaningful statistics such as maxima, minima and trends can be observed.
The creation and analysis of trend data is a common requirement of context-driven systems - therefore the FIWARE platform offers a generic enabler (STH-Comet) specifically to deal with the issue of persisting and interpreting time series data persisted into MongoDB. STH-Comet itself can be used in two modes:
- In minimal mode, STH-Comet is responsible for both data collection and interpreting the data when requested.
- In formal mode, the collection of data is delegated to Cygnus, STH-Comet merely reads from an existing database.
Of the two modes of operation, the formal mode is more flexible, but minimal mode is simpler and easier to set-up. The key differences between the two are summarized in the table below:
| minimal mode | formal mode | |
|---|---|---|
| Is the system easy to set-up properly? | Only one configuration supported - Easy to set up | Highly configurable - Complex to set up |
| Which component is responsible for a data persistence? | STH-Comet | Cygnus |
| What is the role of STH-Comet? | Reading and writing data | Data Read only |
| What is the role of Cygnus? | Not Used | Data Write only |
| Where is the data aggregated? | MongoDB database connected to STH-Comet only | MongoDB database connected to both Cygnus and STH-Comet |
| Can the system be configured to use other databases? | No | Yes |
| Does the solution scale easily? | Does not scale easily - use for simple systems | Scales easily - use for complex systems |
| Can the system cope with high rates of throughput? | No - use where throughput is low | Yes - use where throughput is high |
Analyzing time series data
The appropriate use of time series data analysis will depend on your use case and the reliability of the data measurements you receive. Time series data analysis can be used to answer questions such as:
- What was the maximum measurement of a device within a given time period?
- What was the average measurement of a device within a given time period?
- What was the sum of the measurements sent by a device within a given time period?
It can also be used to reduce the significance of each individual data point to exclude outliers by smoothing.
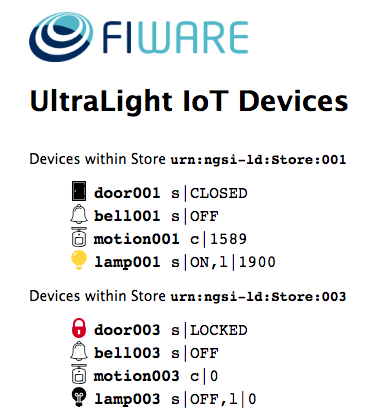
Device Monitor
For the purpose of this tutorial, a series of dummy IoT devices have been created, which will be attached to the context
broker. Details of the architecture and protocol used can be found in the IoT Sensors tutorial. The
state of each device can be seen on the JSON device monitor web page found at: http://localhost:3000/device/monitor
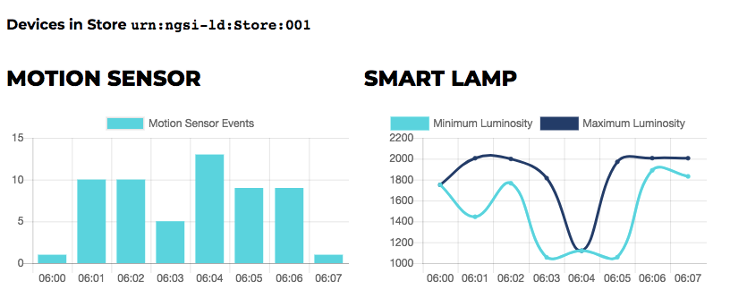
Device History
Once STH-Comet has started aggregating data, the historical state of each device can be seen on the device history
web page found at: http://localhost:3000/device/history/urn:ngsi-ld:Store:001
Architecture
This application builds on the components and dummy IoT devices created in previous tutorials. It will use three or four FIWARE components depending on the configuration of the system: the Orion Context Broker, the IoT Agent for JSON, STH-Comet and Cygnus.
Therefore, the overall architecture will consist of the following elements:
- Four FIWARE Generic Enablers:
- The FIWARE Orion Context Broker which will receive requests using NGSI-v2.
- The FIWARE IoT Agent for JSON which will receive northbound measurements from the dummy IoT devices in JSON format and convert them to NGSI-v2 requests for the context broker to alter the state of the context entities.
- FIWARE STH-Comet will:
- interpret time-based data queries.
- subscribe to context changes and persist them into a MongoDB database (minimal mode only).
- FIWARE Cygnus where it will subscribe to context changes and persist them into a MongoDB database (formal mode only).
Note: Cygnus will only be used if STH-Comet is configured in formal mode.
- A MongoDB database: + Used by the Orion Context Broker to hold context data information such as data entities, subscriptions and registrations + Used by the IoT Agent to hold device information such as device URLs and Keys + Used as a data sink to hold time-based historical context data + In minimal mode - this is read and populated by STH-Comet + In formal mode - this is populated by Cygnus and read by STH-Comet.
- Three Context Providers:
- The Stock Management Frontend is not used in this tutorial. It does the following:
- Display store information and allow users to interact with the dummy IoT devices.
- Show which products can be bought at each store.
- Allow users to "buy" products and reduce the stock count.
- A webserver acting as set of dummy IoT devices using the JSON protocol running over HTTP.
- The Context Provider NGSI proxy is not used in this tutorial. It does the following:
- The Stock Management Frontend is not used in this tutorial. It does the following:
Since all interactions between the services are initiated by HTTP requests, the services can be containerized and run from exposed ports.
The specific architecture of both the minimal and formal configurations is discussed below.
Video: Short-Term History
![]()
Click on the image above to watch a demo of this tutorial persisting context data using STH-Comet
Start Up
Before you start you should ensure that you have obtained or built the necessary Docker images locally. Please clone the repository and create the necessary images by running the commands as shown:
#!/bin/bash
git clone https://github.com/FIWARE/tutorials.Short-Term-History.git
cd tutorials.Short-Term-History

./services create
Thereafter, all services can be initialized from the command-line by running the services Bash script provided within the repository:
./services <command>
Where <command> will vary depending upon the mode we wish to activate. This command will also import seed data from
the previous tutorials and provision the dummy IoT sensors on startup.
Note: If you want to clean up and start over again you can do so with the following command:
./services stop
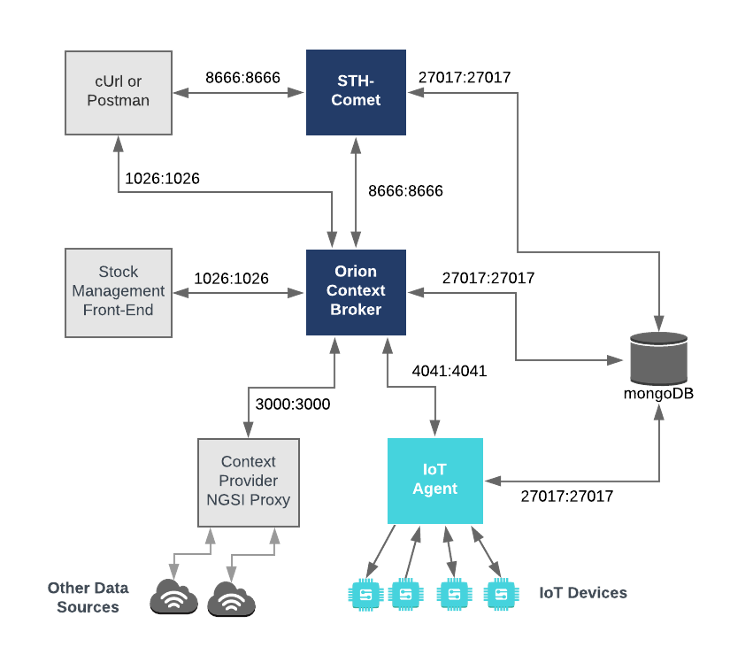
minimal mode (STH-Comet only)
In the minimal configuration, STH-Comet is used to persisting historic context data and also used to make
time-based queries. All operations take place on the same port 8666. The MongoDB instance listening on the standard
27017 port is used to hold data the historic context data as well as holding data related to the Orion Context
Broker and the IoT Agent. The overall architecture can be seen below:
Database Server Configuration
mongo-db:
    image: mongo:4.2
    hostname: mongo-db
    container_name: db-mongo
    ports:
        - '27017:27017'
    networks:
        - default
STH-Comet Configuration
sth-comet:
    image: quay.io/fiware/sth-comet
    hostname: sth-comet
    container_name: fiware-sth-comet
    depends_on:
        - mongo-db
    networks:
        - default
    ports:
        - '8666:8666'
    environment:
        - STH_HOST=0.0.0.0
        - STH_PORT=8666
        - DB_PREFIX=sth_
        - DB_URI=mongo-db:27017
        - LOGOPS_LEVEL=DEBUG
The sth-comet container is listening on one port:
- The Operations for port for STH-Comet -
8666is where the service will be listening for notifications from the Orion context broker as well as time based query requests from cUrl or Postman.
The sth-comet container is driven by environment variables as shown:
| Key | Value | Description |
|---|---|---|
| STH_HOST | 0.0.0.0 |
The address where STH-Comet is hosted - within this container it means all IPv4 addresses on the local machine |
| STH_PORT | 8666 |
Operations Port that STH-Comet listens on, it is also used when subscribing to context data changes |
| DB_PREFIX | sth_ |
The prefix added to each database entity if none is provided |
| DB_URI | mongo-db:27017 |
The MongoDB server which STH-Comet will contact to persist historical context data |
| LOGOPS_LEVEL | DEBUG |
The logging level for STH-Comet |
minimal mode - Start up
To start the system using the minimal configuration using STH-Comet only, run the following command:
./services sth-comet
STH-Comet - Checking Service Health
Once STH-Comet is running, you can check the status by making an HTTP request to the exposed STH_PORT port. If the
response is blank, this is usually because STH-Comet is not running or is listening on another port.
1 Request:
curl -X GET \
  'http://localhost:8666/version'
Response:
Tip: Use jq to format the JSON responses in this tutorial. Pipe the result by appending
| jq '.'
The response will look similar to the following:
{
    "version": "2.3.0-next"
}
Troubleshooting: What if the response is blank ?
- To check that a docker container is running try
docker psYou should see several containers running. If
sth-cometorcygnusis not running, you can restart the containers as necessary.
Generating Context Data
For the purpose of this tutorial, we must be monitoring a system where the context is periodically being updated. The
dummy IoT Sensors can be used to do this. Open the device monitor page at http://localhost:3000/device/monitor and
unlock a Smart Door and switch on a Smart Lamp. This can be done by selecting an appropriate the command from
the drop-down list and pressing the send button. The stream of measurements coming from the devices can then be seen
on the same page:

minimal mode - Subscribing STH-Comet to Context Changes
Once a dynamic context system is up and running, under minimal mode, STH-Comet needs to be informed of changes in context. Therefore, we need to set up a subscription in the Orion Context Broker to notify STH-Comet of these changes. The details of the subscription will differ dependent upon the device being monitored and the sampling rate.
STH-Comet - Aggregate Motion Sensor Count Events
The rate of change of the Motion Sensor is driven by events in the real-world. We need to receive every event to be able to aggregate the results.
This is done by making a POST request to the /v2/subscription endpoint of the Orion Context Broker.
- The
fiware-serviceandfiware-servicepathheaders are used to filter the subscription to only listen to measurements from the attached IoT Sensors. - The
idPatternin the request body ensures that STH-Comet will be informed of all Motion Sensor data changes. - The notification
urlmust match the configuredSTH_PORT. - The
attrsFormat=legacyis required since STH-Comet currently only accepts notifications in the older NGSI v1 format.
2 Request:
curl -iX POST \
  'http://localhost:1026/v2/subscriptions/' \
  -H 'Content-Type: application/json' \
  -H 'fiware-service: openiot' \
  -H 'fiware-servicepath: /' \
  -d '{
  "description": "Notify STH-Comet of all Motion Sensor count changes",
  "subject": {
    "entities": [
      {
        "idPattern": "Motion.*"
      }
    ],
    "condition": {"attrs": ["count"] }
  },
  "notification": {
    "http": {
      "url": "http://sth-comet:8666/notify"
    },
    "attrs": [
      "count"
    ],
    "attrsFormat": "legacy"
  }
}'
STH-Comet - Sample Lamp Luminosity
The luminosity of the Smart Lamp is constantly changing, we only need to sample the values to be able to work out relevant statistics such as minimum and maximum values and rates of change.
This is done by making a POST request to the /v2/subscription endpoint of the Orion Context Broker and including
the throttling attribute in the request body.
- The
fiware-serviceandfiware-servicepathheaders are used to filter the subscription to only listen to measurements from the attached IoT Sensors. - The
idPatternin the request body ensures that STH-Comet will be informed of all Smart Lamp data changes only. - The notification
urlmust match the configuredSTH_PORT. - The
attrsFormat=legacyis required since STH-Comet currently only accepts notifications in the older NGSI v1 format. - The
throttlingvalue defines the rate that changes are sampled.
Note: Be careful when throttling subscriptions as sequential updates will not be persisted as expected.
For example if an JSON device sends the measurement
t|20|l|1200it will be a single atomic commit and both attributes will be included the notification to STH-Comet however is a device sendst|20#l|1200this will be treated as two atomic commits - a notification will be sent for the first change int, but the second change inlwill be ignored as the entity has been recently updated within the sampling period.
3 Request:
curl -iX POST \
  'http://localhost:1026/v2/subscriptions/' \
  -H 'Content-Type: application/json' \
  -H 'fiware-service: openiot' \
  -H 'fiware-servicepath: /' \
  -d '{
  "description": "Notify STH-Comet to sample Lamp luminosity every five seconds",
  "subject": {
    "entities": [
      {
        "idPattern": "Lamp.*"
      }
    ],
    "condition": {
      "attrs": [
        "luminosity"
      ]
    }
  },
  "notification": {
    "http": {
      "url": "http://sth-comet:8666/notify"
    },
    "attrs": [
      "luminosity"
    ],
    "attrsFormat": "legacy"
  },
  "throttling": 5
}'
Time Series Data Queries
The queries in this section assume you have already connected STH-Comet using either minimal mode or formal mode and have collected some data.
Prerequisites
STH-Comet will only be able to retrieve time series data if sufficient data points have already been aggregated within the system. Please ensure that the Smart Door has been unlocked and the Smart Lamp has been switched on and the subscriptions have been registered. Data should be collected for at least a minute before the tutorial.
Check that Subscriptions Exist
You can note that the fiware-service and fiware-servicepath headers must be set in the query and match the values
used when setting up the subscription
4 Request:
curl -X GET \
  'http://localhost:1026/v2/subscriptions/' \
  -H 'fiware-service: openiot' \
  -H 'fiware-servicepath: /'
The result should not be empty.
Offsets, Limits and Pagination
List the first N sampled values
This example shows the first 3 sampled luminosity values from Lamp:001.
To obtain the short term history of a context entity attribute, send a GET request to
../STH/v1/contextEntities/type/<Entity>/id/<entity-id>/attributes/<attribute>
the hLimit parameter restricts the result to N values. hOffset=0 will start with the first value.
5 Request:
curl -G -X GET \
  'http://localhost:8666/STH/v1/contextEntities/type/Lamp/id/Lamp:001/attributes/luminosity' \
  -d 'hLimit=3' \
  -d 'hOffset=0' \
  -H 'fiware-service: openiot' \
  -H 'fiware-servicepath: /'
Response:
{
    "contextResponses": [
        {
            "contextElement": {
                "attributes": [
                    {
                        "name": "luminosity",
                        "values": [
                            {
                                "recvTime": "2018-06-21T12:20:19.841Z",
                                "attrType": "Integer",
                                "attrValue": "1972"
                            },
                            {
                                "recvTime": "2018-06-21T12:20:20.819Z",
                                "attrType": "Integer",
                                "attrValue": "1982"
                            },
                            {
                                "recvTime": "2018-06-21T12:20:29.923Z",
                                "attrType": "Integer",
                                "attrValue": "1937"
                            }
                        ]
                    }
                ],
                "id": "Lamp:001",
                "isPattern": false,
                "type": "Lamp"
            },
            "statusCode": {
                "code": "200",
                "reasonPhrase": "OK"
            }
        }
    ]
}
List N sampled values at an Offset
This example shows the fourth, fifth and sixth sampled count values from Motion:001.
To obtain the short term history of a context entity attribute, send a GET request to
../STH/v1/contextEntities/type/<Entity>/id/<entity-id>/attributes/<attribute>
the hLimit parameter restricts the result to N values. Setting hOffset to a non-zero value will start from the Nth
measurement.
6 Request:
curl -G -X GET \
  'http://localhost:8666/STH/v1/contextEntities/type/Motion/id/Motion:001/attributes/count' \
  -d 'hLimit=3' \
  -d 'hOffset=3' \
  -H 'fiware-service: openiot' \
  -H 'fiware-servicepath: /'
Response:
{
    "contextResponses": [
        {
            "contextElement": {
                "attributes": [
                    {
                        "name": "count",
                        "values": [
                            {
                                "recvTime": "2018-06-21T12:37:00.358Z",
                                "attrType": "Integer",
                                "attrValue": "1"
                            },
                            {
                                "recvTime": "2018-06-21T12:37:01.368Z",
                                "attrType": "Integer",
                                "attrValue": "0"
                            },
                            {
                                "recvTime": "2018-06-21T12:37:07.461Z",
                                "attrType": "Integer",
                                "attrValue": "1"
                            }
                        ]
                    }
                ],
                "id": "Motion:001",
                "isPattern": false,
                "type": "Motion"
            },
            "statusCode": {
                "code": "200",
                "reasonPhrase": "OK"
            }
        }
    ]
}
List the latest N sampled values
This example shows latest three sampled count values from Motion:001.
To obtain the short term history of a context entity attribute, send a GET request to
../STH/v1/contextEntities/type/<Entity>/id/<entity-id>/attributes/<attribute>
If the lastN parameter is set, the result will return the N latest measurements only.
7 Request:
curl -G -X GET \
  'http://localhost:8666/STH/v1/contextEntities/type/Motion/id/Motion:001/attributes/count' \
  -d 'lastN=3' \
  -H 'fiware-service: openiot' \
  -H 'fiware-servicepath: /'
Response:
{
    "contextResponses": [
        {
            "contextElement": {
                "attributes": [
                    {
                        "name": "count",
                        "values": [
                            {
                                "recvTime": "2018-06-21T12:47:28.377Z",
                                "attrType": "Integer",
                                "attrValue": "0"
                            },
                            {
                                "recvTime": "2018-06-21T12:48:08.930Z",
                                "attrType": "Integer",
                                "attrValue": "1"
                            },
                            {
                                "recvTime": "2018-06-21T12:48:13.989Z",
                                "attrType": "Integer",
                                "attrValue": "0"
                            }
                        ]
                    }
                ],
                "id": "Motion:001",
                "isPattern": false,
                "type": "Motion"
            },
            "statusCode": {
                "code": "200",
                "reasonPhrase": "OK"
            }
        }
    ]
}
Time Period Queries
List the sum of values over a time period
This example shows total count values from Motion:001 over each minute
To obtain the short term history of a context entity attribute, send a GET request to
../STH/v1/contextEntities/type/<Entity>/id/<entity-id>/attributes/<attribute>
The aggrMethod parameter determines the type of aggregation to perform over the time series, the aggrPeriod is one
of second, minute, hour or day.
Always select the most appropriate time period based on the frequency of your data collection. minute has been
selected because the Motion:001 is firing a few times within each minute.
8 Request:
curl -G -X GET \
  'http://localhost:8666/STH/v1/contextEntities/type/Motion/id/Motion:001/attributes/count' \
  -d 'aggrMethod=sum' \
  -d 'aggrPeriod=minute' \
  -H 'fiware-service: openiot' \
  -H 'fiware-servicepath: /'
Response:
{
    "contextResponses": [
        {
            "contextElement": {
                "attributes": [
                    {
                        "name": "count",
                        "values": [
                            {
                                "_id": {
                                    "attrName": "count",
                                    "origin": "2018-06-21T12:00:00.000Z",
                                    "resolution": "minute"
                                },
                                "points": [
                                    {
                                        "offset": 37,
                                        "samples": 3,
                                        "sum": 1
                                    },
                                    {
                                        "offset": 38,
                                        "samples": 12,
                                        "sum": 6
                                    },
                                    {
                                        "offset": 39,
                                        "samples": 7,
                                        "sum": 4
                                    },
                                    ...etc
                                ]
                            }
                        ]
                    }
                ],
                "id": "Motion:001",
                "isPattern": false,
                "type": "Motion"
            },
            "statusCode": {
                "code": "200",
                "reasonPhrase": "OK"
            }
        }
    ]
}
Querying for the mean value within a time period is not directly supported.
This example shows sum of luminosity values from Lamp:001 over each minute. When combined with the number of samples
the within the time period an average can be calculated from the data.
To obtain the short term history of a context entity attribute, send a GET request to
../STH/v1/contextEntities/type/<Entity>/id/<entity-id>/attributes/<attribute>
The aggrMethod parameter determines the type of aggregation to perform over the time series, the aggrPeriod is one
of second, minute, hour or day.
9 Request:
curl -G -X GET \
  'http://localhost:8666/STH/v1/contextEntities/type/Lamp/id/Lamp:001/attributes/luminosity' \
  -d 'aggrMethod=sum' \
  -d 'aggrPeriod=minute' \
  -H 'fiware-service: openiot' \
  -H 'fiware-servicepath: /'
Response:
{
    "contextResponses": [
        {
            "contextElement": {
                "attributes": [
                    {
                        "name": "luminosity",
                        "values": [
                            {
                                "_id": {
                                    "attrName": "luminosity",
                                    "origin": "2018-06-21T12:00:00.000Z",
                                    "resolution": "minute"
                                },
                                "points": [
                                    {
                                        "offset": 20,
                                        "samples": 9,
                                        "sum": 17382
                                    },
                                    {
                                        "offset": 21,
                                        "samples": 8,
                                        "sum": 15655
                                    },
                                    {
                                        "offset": 22,
                                        "samples": 5,
                                        "sum": 9630
                                    },
                                    ...etc
                                ]
                            }
                        ]
                    }
                ],
                "id": "Lamp:001",
                "isPattern": false,
                "type": "Lamp"
            },
            "statusCode": {
                "code": "200",
                "reasonPhrase": "OK"
            }
        }
    ]
}
List the minimum of a value over a time period
This example shows minimum luminosity values from Lamp:001 over each minute
To obtain the short term history of a context entity attribute, send a GET request to
../STH/v1/contextEntities/type/<Entity>/id/<entity-id>/attributes/<attribute>
The aggrMethod parameter determines the type of aggregation to perform over the time series, the aggrPeriod is one
of second, minute, hour or day.
The luminosity of the Smart Lamp is continually changing and therefore tracking the minimum value makes sense. The Motion Sensor is not suitable for this as it only offers binary values.
10 Request:
curl -G -X GET \
  'http://localhost:8666/STH/v1/contextEntities/type/Lamp/id/Lamp:001/attributes/luminosity' \
  -d 'aggrMethod=min' \
  -d 'aggrPeriod=minute' \
  -H 'fiware-service: openiot' \
  -H 'fiware-servicepath: /'
Response:
{
    "contextResponses": [
        {
            "contextElement": {
                "attributes": [
                    {
                        "name": "luminosity",
                        "values": [
                            {
                                "_id": {
                                    "attrName": "luminosity",
                                    "origin": "2018-06-21T12:00:00.000Z",
                                    "resolution": "minute"
                                },
                                "points": [
                                    {
                                        "offset": 20,
                                        "samples": 9,
                                        "min": 1793
                                    },
                                    {
                                        "offset": 21,
                                        "samples": 8,
                                        "min": 1819
                                    },
                                    {
                                        "offset": 22,
                                        "samples": 5,
                                        "min": 1855
                                    },
                                    ..etc
                                ]
                            }
                        ]
                    }
                ],
                "id": "Lamp:001",
                "isPattern": false,
                "type": "Lamp"
            },
            "statusCode": {
                "code": "200",
                "reasonPhrase": "OK"
            }
        }
    ]
}
List the maximum of a value over a time period
This example shows maximum luminosity values from Lamp:001 over each minute
To obtain the short term history of a context entity attribute, send a GET request to
../STH/v1/contextEntities/type/<Entity>/id/<entity-id>/attributes/<attribute>
The aggrMethod parameter determines the type of aggregation to perform over the time series, the aggrPeriod is one
of second, minute, hour or day.
11 Request:
curl -G -X GET \
  'http://localhost:8666/STH/v1/contextEntities/type/Lamp/id/Lamp:001/attributes/luminosity' \
  -d 'aggrMethod=max' \
  -d 'aggrPeriod=minute' \
  -H 'fiware-service: openiot' \
  -H 'fiware-servicepath: /'
Response:
{
    "contextResponses": [
        {
            "contextElement": {
                "attributes": [
                    {
                        "name": "luminosity",
                        "values": [
                            {
                                "_id": {
                                    "attrName": "luminosity",
                                    "origin": "2018-06-21T12:00:00.000Z",
                                    "resolution": "minute"
                                },
                                "points": [
                                    {
                                        "offset": 20,
                                        "samples": 9,
                                        "max": 2005
                                    },
                                    {
                                        "offset": 21,
                                        "samples": 8,
                                        "max": 2006
                                    },
                                    {
                                        "offset": 22,
                                        "samples": 5,
                                        "max": 1988
                                    },
                                    ...etc
                                ]
                            }
                        ]
                    }
                ],
                "id": "Lamp:001",
                "isPattern": false,
                "type": "Lamp"
            },
            "statusCode": {
                "code": "200",
                "reasonPhrase": "OK"
            }
        }
    ]
}
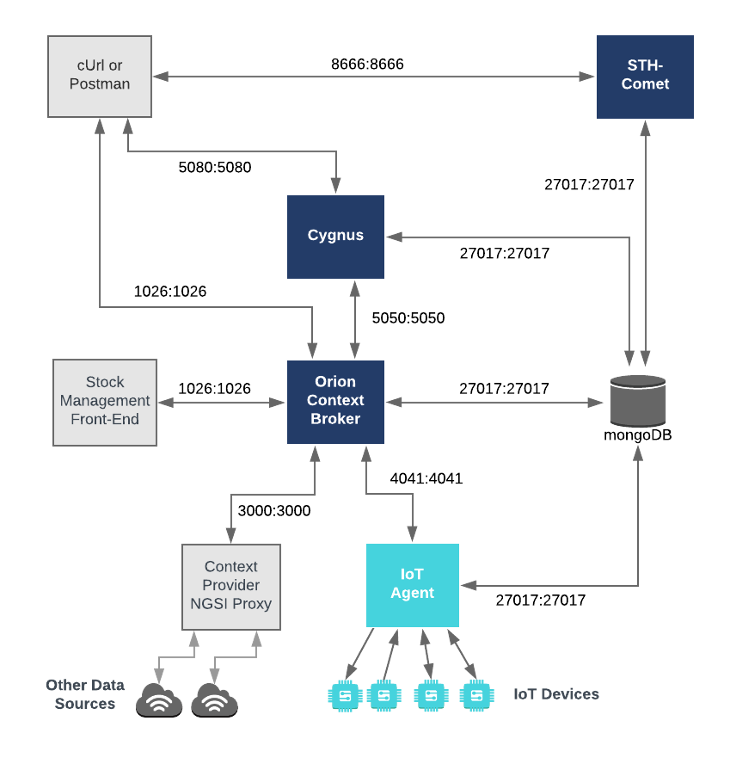
formal mode (Cygnus + STH-Comet)
The formal configuration is uses Cygnus to persist historic context data into a MongoDB database in the same
manner as had been presented in the previous tutorial. The existing MongoDB instance
(listening on the standard 27017 port) is used to hold data related to the Orion Context Broker, the IoT Agent
and the historic context data persisted by Cygnus. STH-Comet is also attached to the same database to read data
from it. The overall architecture can be seen below:
Database Server Configuration
mongo-db:
    image: mongo:4.2
    hostname: mongo-db
    container_name: db-mongo
    ports:
        - '27017:27017'
    networks:
        - default
STH-Comet Configuration
sth-comet:
    image: quay.io/fiware/sth-comet
    hostname: sth-comet
    container_name: fiware-sth-comet
    depends_on:
        - mongo-db
    networks:
        - default
    ports:
        - '8666:8666'
    environment:
        - STH_HOST=0.0.0.0
        - STH_PORT=8666
        - DB_PREFIX=sth_
        - DB_URI=mongo-db:27017
        - LOGOPS_LEVEL=DEBUG
Cygnus Configuration
cygnus:
    image: quay.io/fiware/cygnus-ngsi:latest
    hostname: cygnus
    container_name: fiware-cygnus
    depends_on:
        - mongo-db
    networks:
        - default
    expose:
        - '5080'
    ports:
        - '5050:5050'
        - '5080:5080'
    environment:
        - 'CYGNUS_MONGO_HOSTS=mongo-db:27017'
        - 'CYGNUS_LOG_LEVEL=DEBUG'
        - 'CYGNUS_SERVICE_PORT=5050'
        - 'CYGNUS_API_PORT=5080'
The sth-comet container is listening on one port:
- The Operations for port for STH-Comet -
8666is where the service will be listening for time based query requests from cUrl or Postman.
The sth-comet container is driven by environment variables as shown:
| Key | Value | Description |
|---|---|---|
| STH_HOST | 0.0.0.0 |
The address where STH-Comet is hosted - within this container it means all IPv4 addresses on the local machine |
| STH_PORT | 8666 |
Operations Port that STH-Comet listens on |
| DB_PREFIX | sth_ |
The prefix added to each database entity if none is provided |
| DB_URI | mongo-db:27017 |
The MongoDB server which STH-Comet will contact to persist historical context data |
| LOGOPS_LEVEL | DEBUG |
The logging level for STH-Comet |
The cygnus container is listening on two ports:
- The Subscription Port for Cygnus -
5050is where the service will be listening for notifications from the Orion context broker. - The Management Port for Cygnus -
5080is exposed purely for tutorial access - so that cUrl or Postman can make provisioning commands without being part of the same network.
The cygnus container is driven by environment variables as shown:
| Key | Value | Description |
|---|---|---|
| CYGNUS_MONGO_HOSTS | mongo-db:27017 |
Comma separated list of MongoDB servers which Cygnus will contact to persist historical context data |
| CYGNUS_LOG_LEVEL | DEBUG |
The logging level for Cygnus |
| CYGNUS_SERVICE_PORT | 5050 |
Notification Port that Cygnus listens when subscribing to context data changes |
| CYGNUS_API_PORT | 5080 |
Port that Cygnus listens on for operational reasons |
formal mode - Start up
To start the system using the formal configuration using Cygnus and STH-Comet, run the following command:
./services cygnus
STH-Comet - Checking Service Health
Once STH-Comet is running, you can check the status by making an HTTP request to the exposed STH_PORT port. If the
response is blank, this is usually because STH-Comet is not running or is listening on another port.
12 Request:
curl -X GET \
  'http://localhost:8666/version'
Response:
The response will look similar to the following:
{
    "version": "2.3.0-next"
}
Cygnus - Checking Service Health
Once Cygnus is running, you can check the status by making an HTTP request to the exposed CYGNUS_API_PORT port. If
the response is blank, this is usually because Cygnus is not running or is listening on another port.
13 Request:
curl -X GET \
  'http://localhost:5080/v1/version'
Response:
The response will look similar to the following:
{
    "success": "true",
    "version": "1.8.0_SNAPSHOT.ed50706880829e97fd4cf926df434f1ef4fac147"
}
Troubleshooting: What if either response is blank ?
- To check that a docker container is running try
docker psYou should see several containers running. If
sth-cometorcygnusis not running, you can restart the containers as necessary.
Generating Context Data
For the purpose of this tutorial, we must be monitoring a system where the context is periodically being updated. The
dummy IoT Sensors can be used to do this. Open the device monitor page at http://localhost:3000/device/monitor and
unlock a Smart Door and switch on a Smart Lamp. This can be done by selecting an appropriate the command from
the drop-down list and pressing the send button. The stream of measurements coming from the devices can then be seen
on the same page:
formal mode - Subscribing Cygnus to Context Changes
In formal mode, Cygnus is responsible for the persistence of historic context data. Once a dynamic context system is up and running, we need to set up a subscription in the Orion Context Broker to notify Cygnus of changes in context - STH-Comet will only be used to read the persisted data.
Cygnus - Aggregate Motion Sensor Count Events
The rate of change of the Motion Sensor is driven by events in the real-world. We need to receive every event to be able to aggregate the results.
This is done by making a POST request to the /v2/subscription endpoint of the Orion Context Broker.
- The
fiware-serviceandfiware-servicepathheaders are used to filter the subscription to only listen to measurements from the attached IoT Sensors. - The
idPatternin the request body ensures that Cygnus will be informed of all Motion Sensor data changes. - The notification
urlmust match the configuredCYGNUS_MONGO_SERVICE_PORT.
14 Request:
curl -iX POST \
  'http://localhost:1026/v2/subscriptions/' \
  -H 'Content-Type: application/json' \
  -H 'fiware-service: openiot' \
  -H 'fiware-servicepath: /' \
  -d '{
  "description": "Notify Cygnus of all Motion Sensor count changes",
  "subject": {
    "entities": [
      {
        "idPattern": "Motion.*"
      }
    ],
    "condition": {
      "attrs": [
        "count"
      ]
    }
  },
  "notification": {
    "http": {
      "url": "http://cygnus:5051/notify"
    },
    "attrs": [
      "count"
    ]
  }
}'
Cygnus - Sample Lamp Luminosity
The luminosity of the Smart Lamp is constantly changing, we only need to sample the values to be able to work out relevant statistics such as minimum and maximum values and rates of change.
This is done by making a POST request to the /v2/subscription endpoint of the Orion Context Broker and including
the throttling attribute in the request body.
- The
fiware-serviceandfiware-servicepathheaders are used to filter the subscription to only listen to measurements from the attached IoT Sensors. - The
idPatternin the request body ensures that Cygnus will be informed of all Smart Lamp data changes only. - The notification
urlmust match the configuredCYGNUS_MONGO_SERVICE_PORT. - The
throttlingvalue defines the rate that changes are sampled.
15 Request:
curl -iX POST \
  'http://localhost:1026/v2/subscriptions/' \
  -H 'Content-Type: application/json' \
  -H 'fiware-service: openiot' \
  -H 'fiware-servicepath: /' \
  -d '{
  "description": "Notify Cygnus to sample Lamp luminosity every five seconds",
  "subject": {
    "entities": [
      {
        "idPattern": "Lamp.*"
      }
    ],
    "condition": {
      "attrs": [
        "luminosity"
      ]
    }
  },
  "notification": {
    "http": {
      "url": "http://cygnus:5051/notify"
    },
    "attrs": [
      "luminosity"
    ]
  },
  "throttling": 5
}'
formal mode - Time Series Data Queries
When reading data from the database, there is no difference between minimal and formal mode, please refer to the previous section of this tutorial to request time-series data from STH-Comet
Accessing Time Series Data Programmatically
Once the JSON response for a specified time series has been retrieved, displaying the raw data is of little use to an end user. It must be manipulated to be displayed in a bar chart, line graph or table listing. This is not within the domain of STH-Comet as it not a graphical tool, but can be delegated to a mashup or dashboard component such as Wirecloud or Knowage.
It can also be retrieved and displayed using a third-party graphing tool appropriate to your coding environment - for
example chartjs. An example of this can be found within the history controller in the
Git Repository.
The basic processing consists of two-step - retrieval and attribute mapping, sample code can be seen below:
function readCometLampLuminosity(id, aggMethod) {
    return new Promise(function (resolve, reject) {
        const url = 'http://sth-comet:8666/STH/v1/contextEntities/type/Lamp/id/Lamp:001/attributes/luminosity';
        const options = {
            method: 'GET',
            url: url,
            qs: { aggrMethod: aggMethod, aggrPeriod: 'minute' },
            headers: {
                'fiware-servicepath': '/',
                'fiware-service': 'openiot'
            }
        };

        request(options, (error, response, body) => {
            return error ? reject(error) : resolve(JSON.parse(body));
        });
    });
}
function cometToTimeSeries(cometResponse, aggMethod) {
    const data = [];
    const labels = [];

    const values = cometResponse.contextResponses[0].contextElement.attributes[0].values[0];
    let date = moment(values._id.origin);

    _.forEach(values.points, (element) => {
        data.push({ t: date.valueOf(), y: element[aggMethod] });
        labels.push(date.format('HH:mm'));
        date = date.clone().add(1, 'm');
    });

    return {
        labels,
        data
    };
}
The modified data is then passed to the frontend to be processed by the third-party graphing tool. The result is shown
here: http://localhost:3000/device/history/urn:ngsi-ld:Store:001.