
Description: This is an introductory tutorial for FIWARE FogFlow that allows its users to dynamically orchestrate the processing flows on edges. It explains how to enable FogFlow on a distributed or a single node system, register user defined workload patterns and orchestrate them on the edges in the form of running tasks. For better understanding, examples have been included in the tutorial.
![]()
Cloud-Edge Computing
The intention of the tutorial is to teach its users how the IoT sensor devices send context data to FogFlow, when and where FogFlow start a processing flow to alters the environment through actuator devices. The figure below gives an overview of the scenario. Sensors, actuators and the dynamic processing flows are explained in the trailing sections in this tutorial, which are relatable to the figure below.
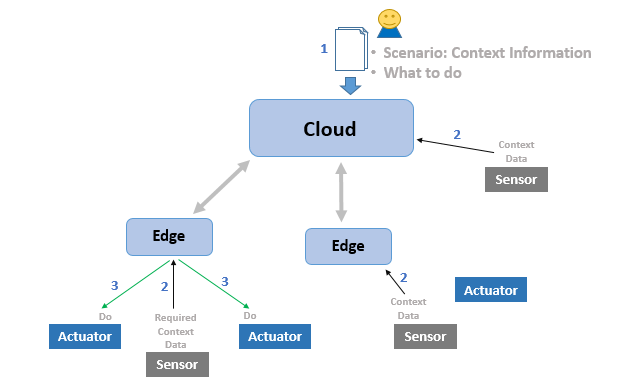
- User provides his scenario to FogFlow, which includes what to do, when to do. FogFlow will figure out where to do.
- Sensors regularly send context data to FogFlow. Data may include environmental data like temperature, video streaming, pictures, etc.
- FogFlow orchestrates processing flows at edges in no time. These processing flows may change the state of an actuator or publish some data back to FogFlow, it is all about what user wants to do.
Architecture
The FogFlow framework operates on a geo-distributed, hierarchical, and heterogeneous ICT infrastructure that includes cloud nodes, edge nodes, and IoT devices. The following figure illustrates the system architecture of FogFlow and its major components across three logical layers.
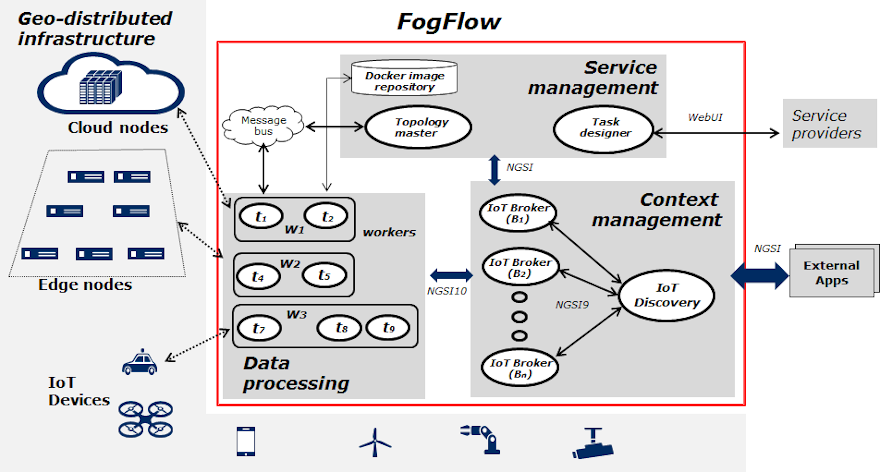
Layered Architecture
Logically, FogFlow consists of the following three layers:
- service management: converts service requirements into concrete execution plan and then deploy the generated execution plan over cloud and edges. Task Designer, Topology Master and Docker Registry services together make up the service management layer.
- context management: manages all context information and make them discoverable and accessible via flexible query and subscribe interfaces. This layer consists of Context Brokers and the IoT Discovery.
- data processing: launches data processing tasks and establish data flows between tasks via the pub/sub interfaces provided by the context management layer. Edge workers (and of course the cloud worker) come under this layer.
Start Up
Before you start you should ensure that you have obtained or built the necessary Docker images locally. Please clone the repository and create the necessary images by running the commands as shown:
#!/bin/bash
git clone https://github.com/FIWARE/tutorials.Edge-Computing.git
cd tutorials.Edge-Computing
git checkout NGSI-v2

./services create
Thereafter, all services can be initialized from the command-line by running the services Bash script provided within the repository:
./services start
Setup FogFlow Cloud Node
Prerequisites for starting up a cloud node are as follows:
- Docker: Please refer this for installation, required version > 18.03.1-ce;
- Docker-Compose: Please refer this for installation, required version > 2.4.2;
Important: Please also allow your user to execute the Docker commands without sudo.
To start the installation of FogFlow cloud services, do the following:
-
Change the following IP addresses in config.json according to the current environment.
- my_hostip: Public IP address of the FogFlow cloud node.
- site_id: Unique string-based ID to identify the node in FogFlow system.
- physical_location: The geolocation of the node.
- worker.capacity: It means the maximal number of docker containers that the FogFlow node can invoke. By default, its value is "8".
{
    "my_hostip": "10.156.0.9",
    "physical_location": {
        "longitude": 139.709059,
        "latitude": 35.692221
    },
    "site_id": "001",
    "worker": {
        "container_autoremove": false,
        "start_actual_task": true,
        "capacity": 8
    }
}
Important !
Please DO NOT use “127.0.0.1” as the IP address of my_hostip, because it is only accessible to a running task inside a docker container.
Firewall rules: To make your FogFlow web portal accessible, the following ports 80 and 5672 over TCP must be open.
Mac Users: If you like to test FogFlow on your Macbook, please install Docker Desktop and also use “host.docker.internal” as my_hostip in the configuration file.
If you need to change the port number(s), please make sure the change is consistence in all these three configuration files.
- Pull the docker images of FogFlow components and start them.
  docker-compose pull
  docker-compose up -d
-
Validate the FogFlow cloud node setup through any of these two ways:
-
Check if all the containers are up and running using
docker ps -a.
docker ps -a
   CONTAINER ID   IMAGE                   COMMAND                  CREATED         STATUS         PORTS                                                                                            NAMES
   e412877b4862   nginx:latest            "/docker-entrypoint.…"   2 minutes ago   Up 2 minutes   0.0.0.0:80->80/tcp                                                                               tutorialsedgecomputing_nginx_1
   29ea8555685d   fogflow/master:3.2      "/master"                2 minutes ago   Up 2 minutes   0.0.0.0:1060->1060/tcp                                                                           tutorialsedgecomputing_master_1
   aaa2f29959e7   fogflow/worker:3.2      "/worker"                2 minutes ago   Up 2 minutes                                                                                                    tutorialsedgecomputing_cloud_worker_1
   1298fe46bf1e   fogflow/designer:3.2    "node main.js"           2 minutes ago   Up 2 minutes   0.0.0.0:1030->1030/tcp, 0.0.0.0:8080->8080/tcp                                                   tutorialsedgecomputing_designer_1
   644333fa6215   fogflow/broker:3.2      "/broker"                2 minutes ago   Up 2 minutes   0.0.0.0:8070->8070/tcp                                                                           tutorialsedgecomputing_cloud_broker_1
   acd974d6c040   fogflow/discovery:3.2   "/discovery"             2 minutes ago   Up 2 minutes   0.0.0.0:8090->8090/tcp                                                                           tutorialsedgecomputing_discovery_1
   cce2c64503d9   dgraph/standalone       "/run.sh"                2 minutes ago   Up 2 minutes   0.0.0.0:6080->6080/tcp, 0.0.0.0:8000->8000/tcp, 0.0.0.0:8082->8080/tcp, 0.0.0.0:9082->9080/tcp   tutorialsedgecomputing_dgraph_1
   925d1deb343f   rabbitmq:3              "docker-entrypoint.s…"   2 minutes ago   Up 2 minutes   4369/tcp, 5671/tcp, 15691-15692/tcp, 25672/tcp, 0.0.0.0:5672->5672/tcp                           tutorialsedgecomputing_rabbitmq_1
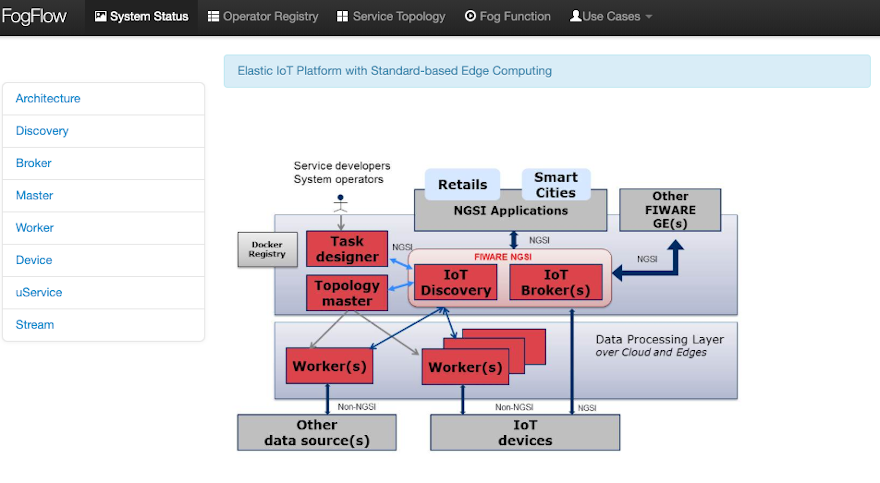
- Check the system status from the FogFlow DashBoard at
http://<coreservice_ip>/index.html. Web page to be displayed is shown in the figure below.
Setup FogFlow Edge Node
Prerequisites for starting up an edge node are as follows:
- Docker: Please refer to Install Docker CE on Raspberry Pi.
To start the installation, do the following:
- Change the configuration file similar to the cloud node, but now coreservice_ip will remain uniform because it is the IP address of the cloud node. my_hostip will change to the public IP address of edge node.
{
    "coreservice_ip": "10.156.0.9",
    "my_hostip": "172.17.0.1",
    "physical_location": {
        "longitude": 138.709059,
        "latitude": 36.692221
    },
    "site_id": "002",

    "worker": {
        "container_autoremove": false,
        "start_actual_task": true,
        "capacity": 4
    }
}
- Start both Edge IoT Broker and FogFlow Worker. If the edge node is ARM-based, then attach arm as the command parameter.
./start.sh
- Stop both Edge IoT Broker and FogFlow Worker:
./stop.sh
Connect IoT Devices to FogFlow
When data flow from a sensor device towards broker, it is called Northbound Flow, whereas it is Southbound Flow, when data flow from broker towards the actuator devices. FogFlow relies on this bidirectional data flow to realize the actual idea behind it.
To receive data from the sensor devices, refer connect to a sensor device. The tutorial contains examples of both NGSI and Non-NGSI devices.
FogFlow can change the state of connected actuator devices, such as, locking a door, switching on a lamp, turning a shield on or off, etc. through its dynamic processing flows. To connect to an actuator device, refer Integrate an actuator device with FogFlow. This tutorial also contains examples of both NGSI and Non-NGSI devices (especially, the JSON and MQTT ones).
To get a basic idea of how Southbound actually works in the context of FIWARE, refer this tutorial.
Dynamic Orchestration at Edges using FogFlow
Before moving further, users must have a look at the following:
- Core concepts of FogFlow and
- Intent-based programming model
Define and trigger a Fog Function
FogFlow enables serverless edge computing, i.e., the developers can define and submit a fog function along with the processing logic (or operator) and then the rest will be done by FogFlow automatically, including:
- triggering the submitted fog function when its input data are available;
- deciding how many instances are to be created according to the defined granularity;
- deciding where to deploy the created instances or processing flows.
Register the Task Operators
FogFlow allows the developers to specify their own function code inside a registered operator. Check out some examples and this tutorial to know how to create a customized operator.
Python, Java and JavaScript templates to write an operator can be found here.
For the current tutorial, refer the steps mentioned below.
The following steps are required to register an operator in FogFlow.
- Register an Operator means to define what would be the name of Operator and what input parameters it would need.
To register Operator, open FogFlow dashboard. Select Operator Registry Tab from horizontal bar, select operator from menu on left and then click register button. Right click on workspace and select operator from drop down list and enter details as shown and at last click on submit.
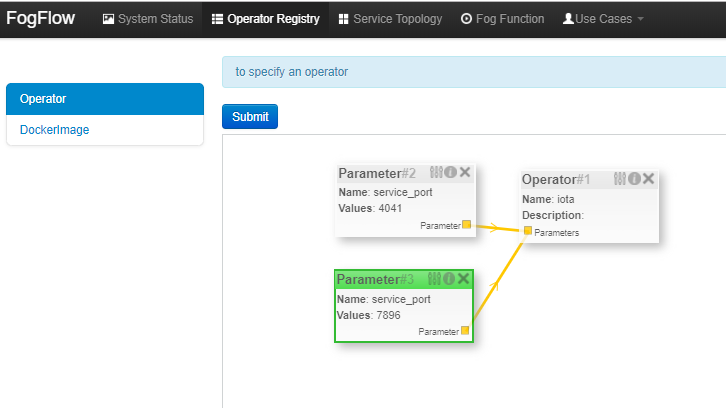
Note :
User can add parameters to operator. To define the port for the operator application, use "service_port" and give a valid port number as its value. The application would be accessible to the outer world through this port.
- Register a Docker Image and choose Operator means to define the docker image and associate an already registered Operator with it. The following picture shows the list of registered docker images and the key information of each image.
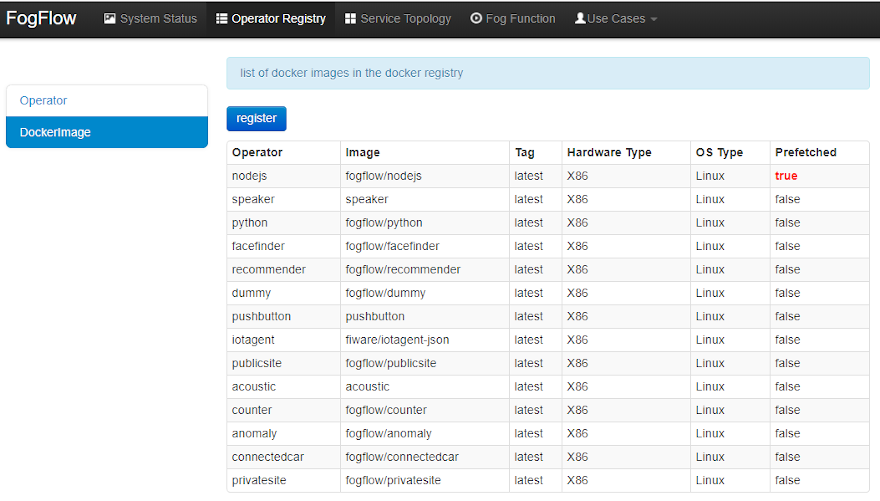
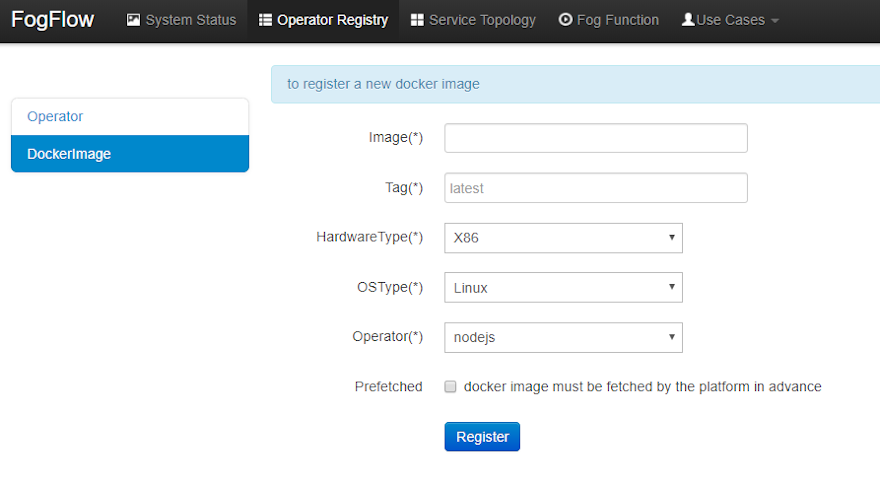
Clicking on "register" button, fill out the required information and click on "register" button to finish the registration.
The form is explained as the following.
- Image: the name of your operator docker image, must be consistent with the one you publish to Docker Hub.
- Tag: the tag you used to publish your operator docker image; by default it is "latest".
- Hardware Type: the hardware type that your docker image supports, including x86 or ARM (e.g. Raspberry Pi).
- OS Type: the operating system type that your docker image supports; currently this is only limited to Linux.
- Operator: the operator name, which must be unique and will be used when defining a service topology.
- Prefetched: if this is checked, that means all edge nodes will start to fetch this docker image in advance; otherwise, the operator docker image is fetched on demand, only when edge nodes need to run a scheduled task associated with this operator.
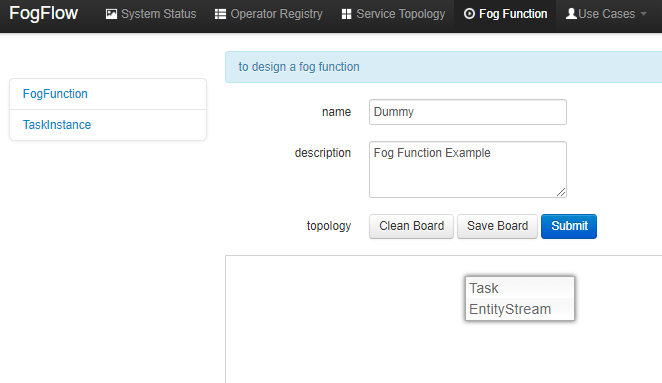
Define a "dummy" Fog Function
Right click inside the task design board, a menu will be displayed that includes:
- Task: is used to define the fog function name and the processing logic (or operator). A task has input and output streams.
- EntityStream: is the input data element which can be linked with a fog function Task as its input data stream.
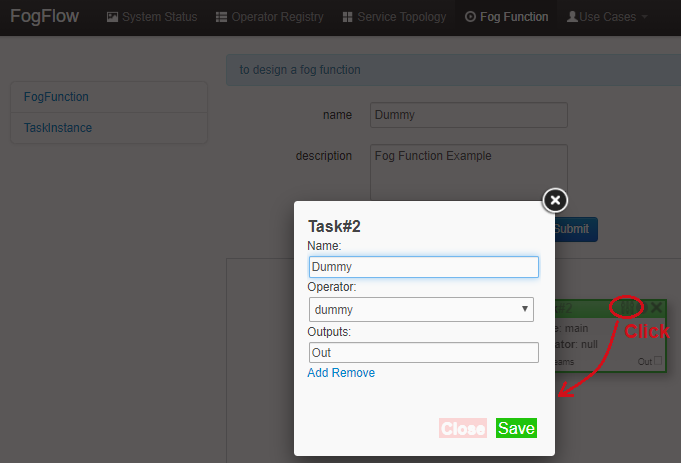
Choose "Task", a Task element will be placed on the design board, as shown below.
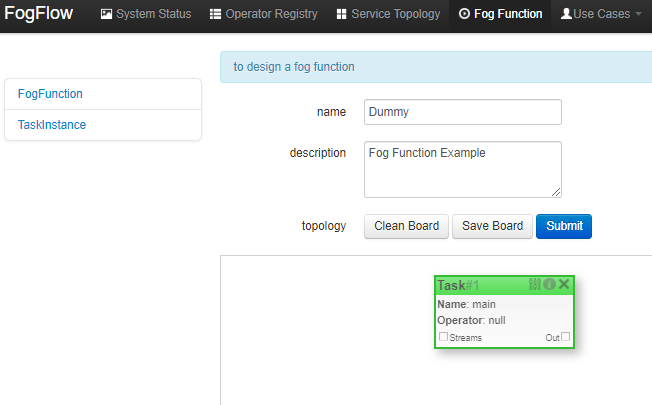
Click the configuration button in the top-right corner of the task element, as illustrated in the following figure. Specify the name of the Task and choose an operator out of a list of some pre-registered operators.
Add an "EntityStream" from the pop-up menu to the design board.
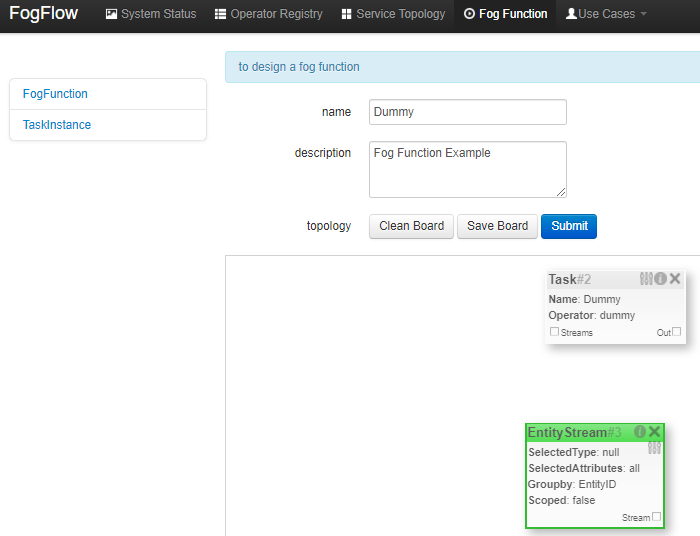
It contains the following fields:
- Selected Type: is used to define the entity type of input stream whose availability will trigger the fog function.
- Selected Attributes: for the selected entity type, which entity attributes are required by your fog function; "all" means to get all entity attributes.
- Group By: should be one of the selected entity attributes, which defines the granularity of this fog function, i.e., the number of instances for this fog function. In this example, the granularity is defined by "id", meaning that FogFlow will create a new task instance for each individual entity ID.
- Scoped: tells if the Entity data are location-specific or not. True indicates that location-specific data are recorded in the Entity and False is used in case of broadcasted data, for example, some rule or threshold data that holds true for all locations, not for a specific location.
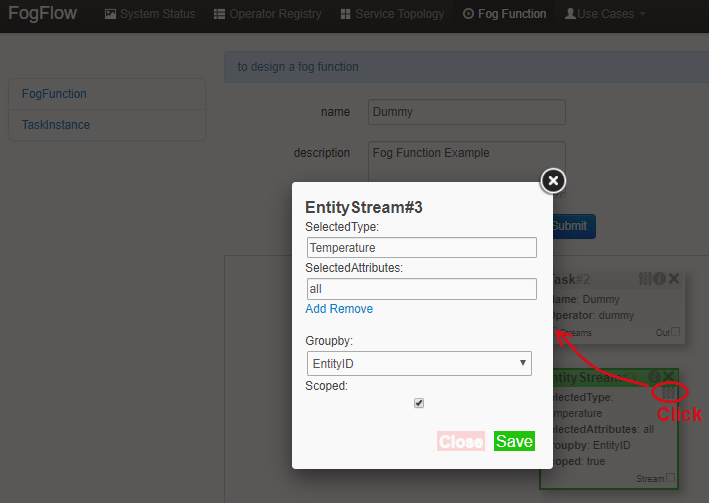
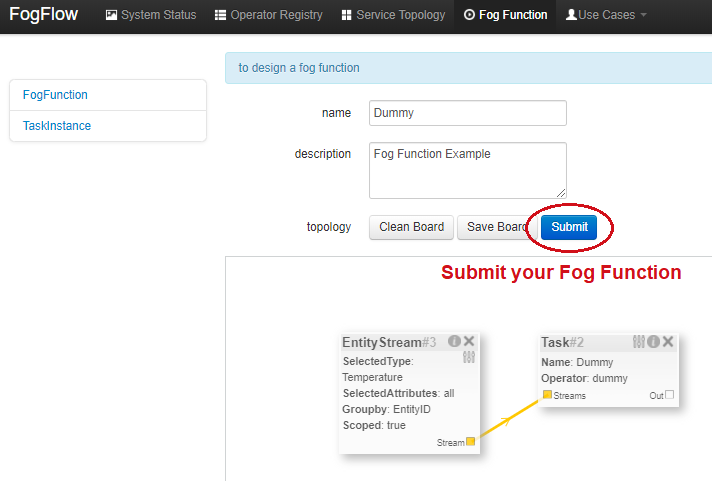
Configure the EntityStream by clicking on its configuration button as shown below. "Temperature" is shown as example here, as is the entity type of input data for the "dummy" fog function.
There can be multiple EntityStreams for a Task, and they must be connected to the Task as shown below.
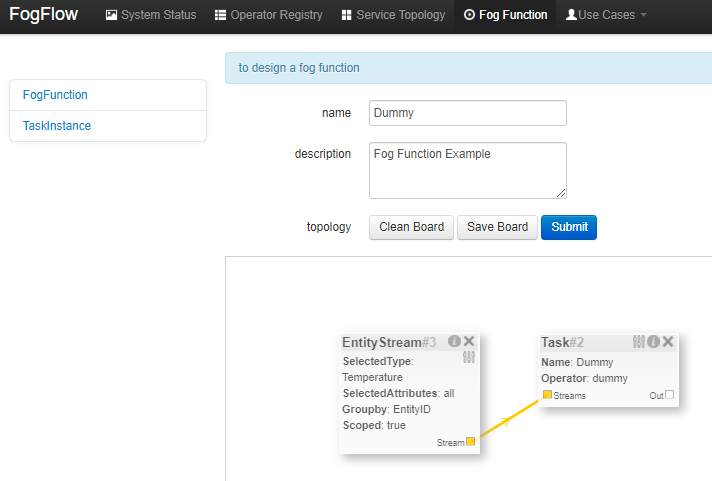
Submit the Fog Function.
Trigger the "dummy" Fog Function
The defined "Dummy" fog function is triggered only when its required input data are available.
One way is to register a "Temperature" sensor device as shown below.
Go to Device menu in System Status tab. Provide the following information.
- Device ID: to specify a unique entity ID.
- Device Type: use "Temperature" as the entity type.
- Location: to place a location on the map.
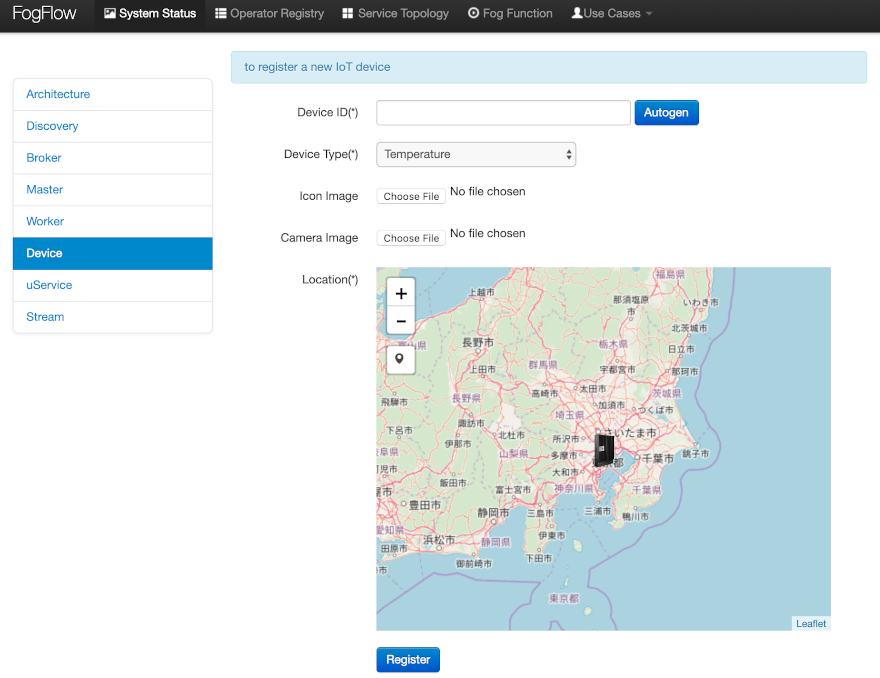
Once the device profile is registered, a new "Temperature" sensor entity will be created, and it will trigger the "dummy" fog function automatically.
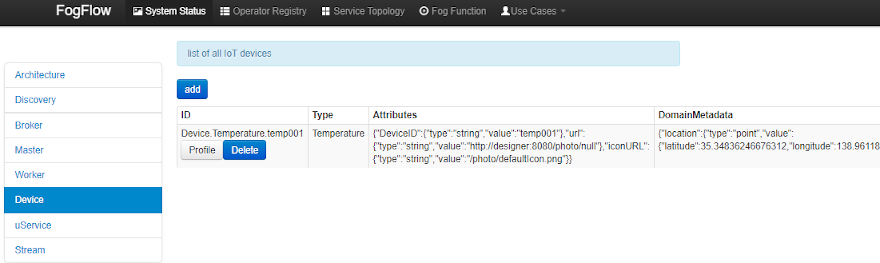
The other way to trigger the fog function is to send an NGSI entity update in the form of a POST request to the FogFlow broker to create the "Temperature" sensor entity.
1 Request
curl -iX POST \
  'http://localhost:8080/ngsi10/updateContext' \
  -H 'Content-Type: application/json' \
  -d '{
    "contextElements": [
        {
            "entityId": {
                "id": "Device.temp001", "type": "Temperature", "isPattern": false
            },
            "attributes": [
                {
                  "name": "temp", "type": "integer", "value": 10
                }
            ],
            "domainMetadata": [
            {
                "name": "location", "type": "point",
                "value": {
                    "latitude": 49.406393,
                    "longitude": 8.684208
                }
            }
            ]
        }
    ],
    "updateAction": "UPDATE"
}'
Verify whether the fog function is triggered or not in the following way.
- check the task instance of this fog function, as shown in the following picture:
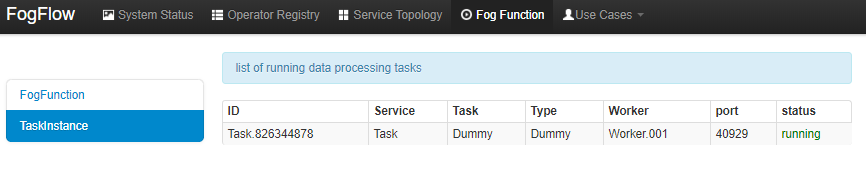
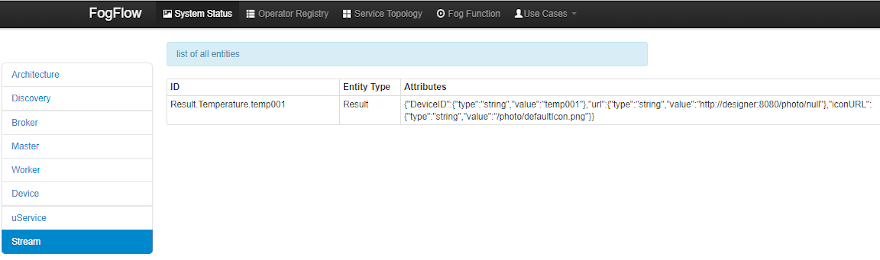
- check the result generated by its running task instance, as shown in the following picture:
Define and trigger a Service Topology
Service topology is defined as a graph of several operators. Each operator in the service topology is annotated with its inputs and outputs, which indicate their dependency on the other tasks in the same topology.
Different from fog functions, a service topology is triggered on demand by a customized "intent" object.
Study of a simple Anomaly Detection use case example can help the developers to define and test a service topology.
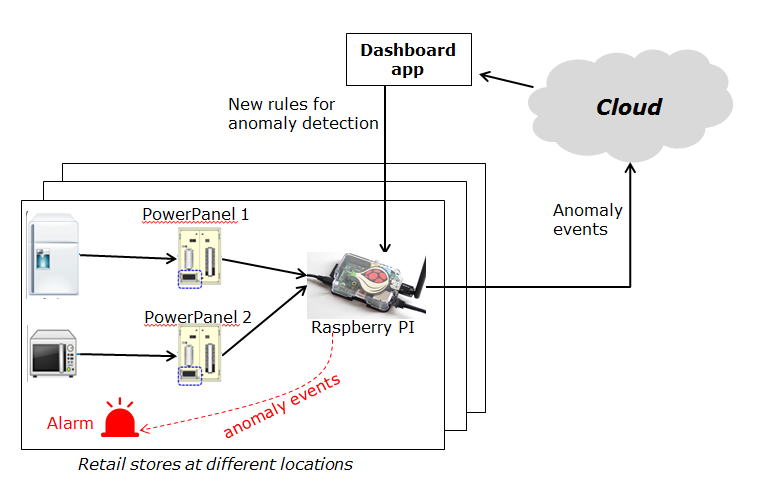
This use case study is for retail stores to detect abnormal energy consumption in real-time. As illustrated in the following picture, a retail company has a large number of shops distributed in different locations. For each shop, a Raspberry Pi device (edge node) is deployed to monitor the power consumption from all Power Panels in the shop. On detection of abnormal power usage in a shop (or edge), the alarm mechanism of shop is triggered to inform the shop owner. Moreover, the detected event is reported to the cloud for information aggregation. The aggregated information is then presented to the system operator via a dashboard service. In addition, the system operator can dynamically update the rule for anomaly detection.
Implement the Operator Functions
For this specific use case, two operators, anomaly and counter are used, which are already registered in FogFlow. Refer to the examples provided in the code repository.
-
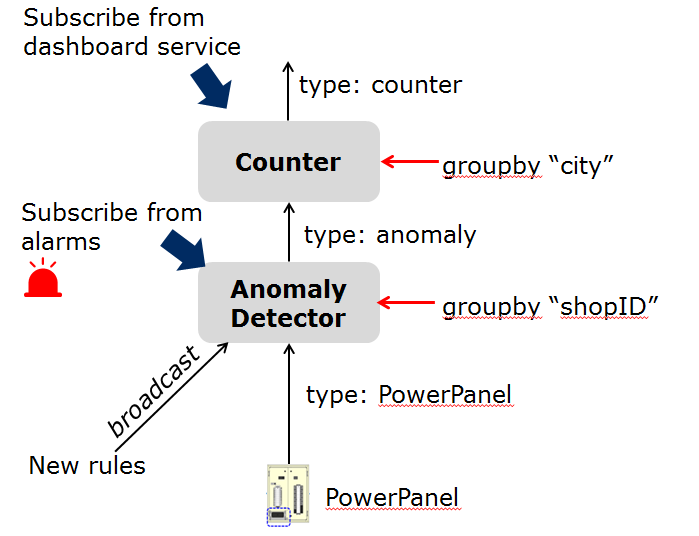
Anomaly Detector operator is to detect anomaly events based on the collected data from power panels in a retail store. It has two types of inputs:
- detection rules are provided and updated by the operator; The detection rules input stream type is associated
with
broadcast, meaning that the rules are needed by all task instances of this operator. The granularity of this operator is based onshopID, meaning that a dedicated task instance will be created and configured for each shop. - sensor data are provided by power panel.
- detection rules are provided and updated by the operator; The detection rules input stream type is associated
with
-
Counter operator is to count the total number of anomaly events for all shops in each city. Therefore, its task granularity is by
city. Its input stream type is the output stream type of the previous operator (Anomaly Detector).
There are two types of result consumers:
- a dashboard service in the cloud, which subscribes to the final aggregation results generated by the counter operator for the global scope;
- the alarm in each shop, which subscribes to the anomaly events generated by the Anomaly Detector task on the local edge node in the retail store.
Specify the Service Topology
Assume that the tasks to be used in the service topology have been implemented and registered, just specify the service topology in the following way using FogFlow Topology Editor.
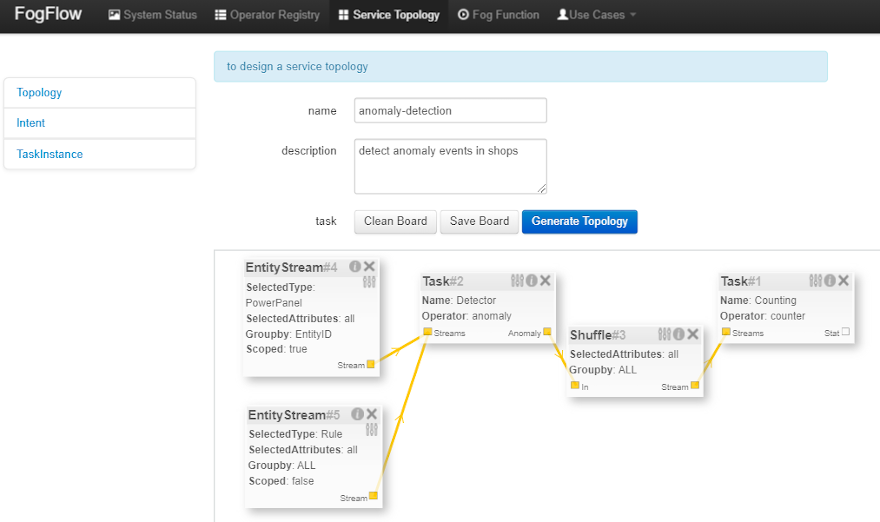
As seen in the picture, the following important information must be provided.
-
define topology profile, including:
- topology name: the unique name of your topology;
- service description: some text to describe what this service is about.
-
draw the graph of data processing flows within the service topology with a right click at some place of the design board, choose either task or input streams or shuffle to define your data processing flows according to the design you have in mind.
-
define the profile for each element in the data flow including the following using the configuration button of each.
- Task profile can be defined by specifying name, operator and entity type.
- EntityStream profile is updated with SelectedType, SelectedAttributes, Groupby, Scoped fields.
- Shuffle element serves as a connector between two tasks such that output of a task is the input for the shuffle element and same is forwarded by Shuffle to another task (or tasks) as input.
Trigger the Service Topology by sending an Intent
Service Topology can be triggered in two steps:
- Sending a high level intent object which breaks the service topology into separate tasks.
- Providing Input Streams to the tasks of that service topology.
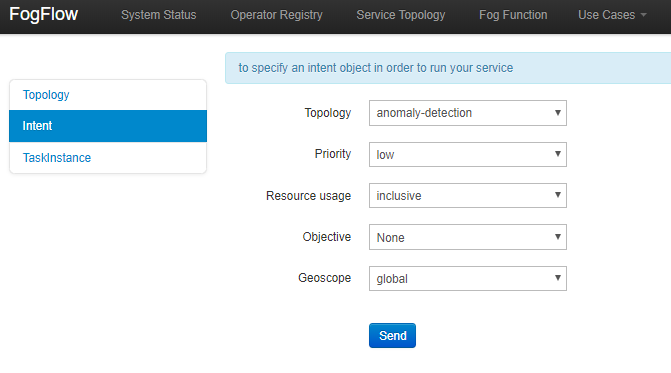
The intent object is sent using the FogFlow dashboard with the following properties:
- Topology: specifies which topology the intent object is meant for.
- Priority: defines the priority level of all tasks in your topology, which will be utilized by edge nodes to decide how resources should be assigned to the tasks.
- Resource Usage: defines how a topology can use resources on edge nodes. Sharing in an exclusive way means the topology will not share the resources with any task from other topologies. The other way is inclusive one.
- Objective: of maximum throughput, minimum latency and minimum cost can be set for task assignment at workers. However, this feature is not fully supported yet, so it can be set as "None" for now.
- Geoscope: is a defined geographical area where input streams should be selected. Global as well as custom geoscopes can be set.
As soon as context data are received, which fall within the scope of the intent object, tasks are launched on the nearest workers.
Here are curl examples to send Input streams for Anomaly-Detector use case. It requires PowerPanel as well as Rule data.
Note: Users can also use Simulated Powerpanel Devices to send PowerPanel data.
The Curl case assumes that the cloud IoT Broker is running on localhost on port 8070.
2 Request
curl -iX POST \
  'http://localhost:8070/ngsi10/updateContext' \
-H 'Content-Type: application/json' \
-d '
    {
    "contextElements": [
        {
            "entityId":{
                "id":"Device.PowerPanel.01", "type":"PowerPanel"
            },
           "attributes":[
                {
                    "name":"usage", "type":"integer", "value":4
                },
                {
                    "name":"shop", "type":"string", "value":"01"
                },
                {
                    "name":"iconURL", "type":"string", "value":"/img/shop.png"
                }
           ],
           "domainMetadata":[
                {
                    "name":"location", "type":"point",
                    "value": {
                        "latitude":35.7,
                        "longitude":138
                    }
                },
                {
                    "name":"shop", "type":"string", "value":"01"
                }
           ]
        }
    ],
    "updateAction": "UPDATE"
}'
Outputs of the Service Topology will be published to the Broker, any application subscribing to the data will receive the notification. An actuator device can also receive these streams as inputs from the Broker. Resulting streams will also be visible in the Streams menu on FogFlow dashboard.
Next Steps
For additional material to understand how FogFlow works, visit FogFlow tutorial. FogFlow can also be integrated with other FIWARE GEs.
-
Integrate FogFlow with NGSI-LD Broker: FogFlow has evolved into a robust platform that supports cloud and edge nodes. The main concept of having distributed edges for edge-computation has evolved with the interaction of FogFlow and other NGSI-LD brokers. NGSI-LD technology is the new horizon of data communication and data representation. FogFlow is now a NGSI_LD compliant broker. For detailed information, please refer this tutorial.
-
Integrate FogFlow with Monitoring Tools: FogFlow has a distributed architecture, and therefore it generates a need to monitor the distributed components of FogFlow from a platform. For this cause FogFlow has integrated grafana and elastisearch, to monitor various components like memory utilisation, CPU utilisation and services current state etc.. To have more details over this topic, follow this tutorial.
-
Integrate FogFlow with Security Components: FogFlow has enhanced itself, by supporting security features. The communication between IoT devices and edges, and communication between cloud and edge has been secured using IDM (Identity Manager - Keyrock) and Wilma (PEP-Proxy). To know more about the security setup in FogFlow, follow this tutorial.
-
Integrate FogFlow with QuantumLeap: FogFlow can integrate with QuantumLeap, which is a REST service for storing, querying and retrieving NGSI-v2 spatial-temporal data. QuantumLeap converts NGSI semi-structured data into tabular format and stores it in a time-series database. This has opened up new possibilities for utilising FogFlow in different scenarios. For more on this, refer the tutorial.
-
Integrate FogFlow with WireCloud: FogFlow has pitched in with different and versatile edge platform technology. WireCloud builds on cutting-edge end user development, RIA and semantic technologies to offer a next-generation end user centred web application mashup platform aimed at leveraging the long tail of the Internet of Services. For more on FogFlow and WireCloud, follow the tutorial.
License
MIT © 2020-2025 FIWARE Foundation e.V.