
![]()
Description: This tutorial is an introduction to FIWARE Draco - an alternative generic enabler which is used to persist context data into third-party databases using Apache NIFI creating a historical view of the context. The in the same manner as the previous tutorial, activates the dummy IoT sensors persists measurements from those sensors into a database for further analysis.
The tutorial uses cUrl commands throughout, but is also available as Postman documentation.

![]()
Data Persistence using Apache NIFI
"Plots within plots, but all roads lead down the dragon’s gullet."
— George R.R. Martin (A Dance With Dragons)
FIWARE Draco is an alternative generic enabler which is able to persist historical context data to a series of databases. Like Cygnus - Draco is able to subscribe to change of state from the Orion Context Broker and provide a funnel to process that data before persisting to a data sink.
As mentioned previously, persisting historical context data is useful for big data analysis or discovering trends or removing outliers. Which tool you use to do this will depend on your needs, and unlike Cygnus Draco offers a graphical interface to set up and monitor the procedure.
A summary of the differences can be seen below:
| Draco | Cygnus |
|---|---|
| Offers an NGSI v2 interface for notifications | Offers an NGSI v2 interface for notifications |
configurable subscription endpoint, but defaults to /v2/notify |
subscription endpoint listens on /notify |
| listens on a single port | listens on separate ports for each input |
| Configured by a graphical interface | Configured via config files |
| Based on Apache NIFI | Based on Apache Flume |
| Draco is docummented here | Cygnus is documented here |
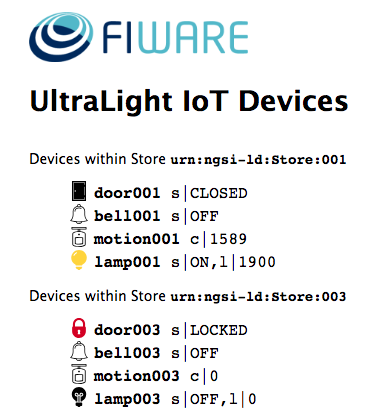
Device Monitor
For the purpose of this tutorial, a series of dummy IoT devices have been created, which will be attached to the context
broker. Details of the architecture and protocol used can be found in the IoT Sensors tutorial. The
state of each device can be seen on the JSON device monitor web page found at http://localhost:3000/device/monitor.
Note: In addition to user interactions, All dummy devices will periodically register a heartbeat message
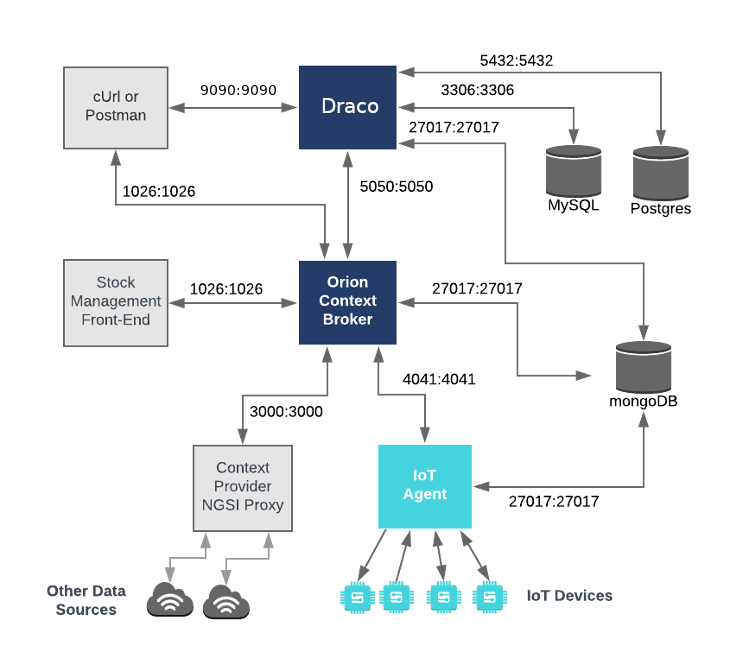
Architecture
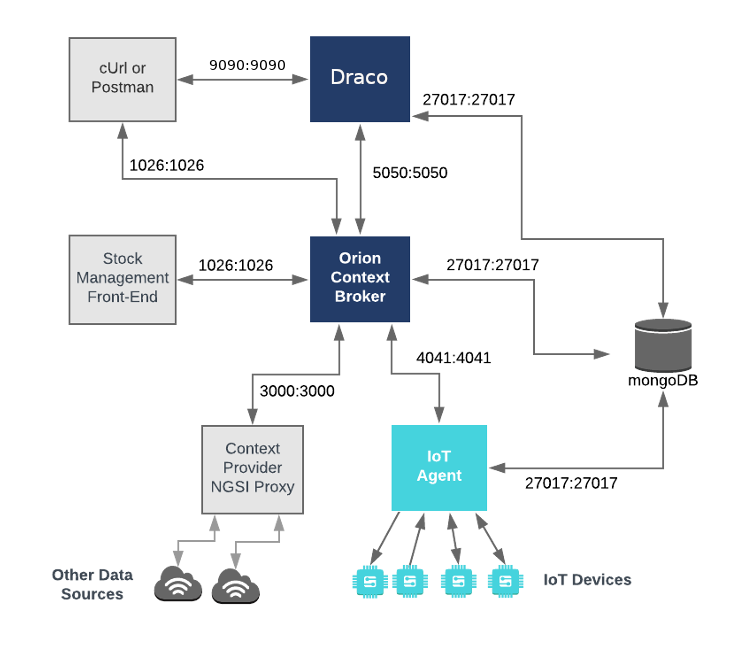
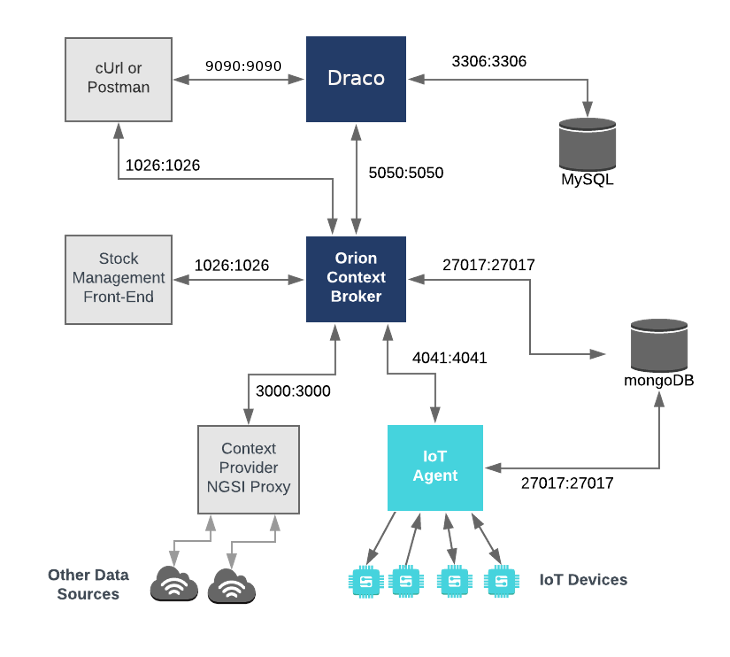
This application builds on the components and dummy IoT devices created in previous tutorials. It will make use of three FIWARE components - the Orion Context Broker, the IoT Agent for JSON and introduce the Draco Generic Enabler for persisting context data to a database. Additional databases are now involved - both the Orion Context Broker and the IoT Agent rely on MongoDB technology to keep persistence of the information they hold, and we will be persisting our historical context data another database - either MySQL , PostgreSQL or MongoDB database.
Therefore, the overall architecture will consist of the following elements:
- Three FIWARE Generic Enablers:
- The FIWARE Orion Context Broker which will receive requests using NGSI-v2.
- The FIWARE IoT Agent for JSON which will receive northbound measurements from the dummy IoT devices in JSON format and convert them to NGSI-v2 requests for the context broker to alter the state of the context entities.
- FIWARE Draco which will subscribe to context changes and persist them into a database (MySQL , PostgreSQL or MongoDB).
- One, two or three of the following Databases:
- The underlying MongoDB database:
- Used by the Orion Context Broker to hold context data information such as data entities, subscriptions and registrations.
- Used by the IoT Agent to hold device information such as device URLs and Keys.
- Potentially used as a data sink to hold historical context data.
- An additional PostgreSQL database:
- Potentially used as a data sink to hold historical context data.
- An additional MySQL database:
- Potentially used as a data sink to hold historical context data.
- The underlying MongoDB database:
- Three Context Providers:
- The Stock Management Frontend is not used in this tutorial. It does the following:
- Display store information and allow users to interact with the dummy IoT devices.
- Show which products can be bought at each store.
- Allow users to "buy" products and reduce the stock count.
- A webserver acting as set of dummy IoT devices using the JSON protocol running over HTTP.
- The Context Provider NGSI proxy is not used in this tutorial. It does the following:
- The Stock Management Frontend is not used in this tutorial. It does the following:
Since all interactions between the services are initiated by HTTP requests, the services can be containerized and run from exposed ports.
The specific architecture of each section of the tutorial is discussed below.
Video: Data Persistence
![]()
Click on the image above to watch a demo of this tutorial persisting context data using Apache NIFI
Start Up
Before you start you should ensure that you have obtained or built the necessary Docker images locally. Please clone the repository and create the necessary images by running the commands as shown:
git clone https://github.com/FIWARE/tutorials.Historic-Context-NIFI.git
cd tutorials.Historic-Context-NIFI

./services create
Thereafter, all services can be initialized from the command-line by running the services Bash script provided within the repository:
./services <command>
Where <command> will vary depending upon the databases we wish to activate. This command will also import seed data
from the previous tutorials and provision the dummy IoT sensors on startup.
Note: If you want to clean up and start over again you can do so with the following command:
./services stop
MongoDB - Persisting Context Data into a Database
Persisting historic context data using MongoDB technology is relatively simple to configure since we are already using a
MongoDB instance to hold data related to the Orion Context Broker and the IoT Agent. The MongoDB instance is listening
on the standard 27017 port and the overall architecture can be seen below:
MongoDB - Database Server Configuration
mongo-db:
    image: mongo:4.2
    hostname: mongo-db
    container_name: db-mongo
    ports:
        - '27017:27017'
    networks:
        - default
MongoDB - Draco Configuration
draco:
    image: ging/fiware-draco:1.1.0
    container_name: draco
    depends_on:
        - mongo-db
    environment:
        - NIFI_WEB_HTTP_PORT=9090
    ports:
        - '9090:9090'
        - '5050:5050'
    healthcheck:
        test: curl --fail -s http://localhost:9090/nifi-api/system-diagnostics || exit 1
The draco container is listening on two ports:
- The Subscription Port for Draco -
5050is where the service will be listening for notifications from the Orion context broker. - The Web interface for Draco -
9090is exposed purely for configuring the processors.
MongoDB - Start up
To start the system with a MongoDB database only, run the following command:
./services mongodb
Then go to your browser and open Draco using this URL http://localhost:9090/nifi.
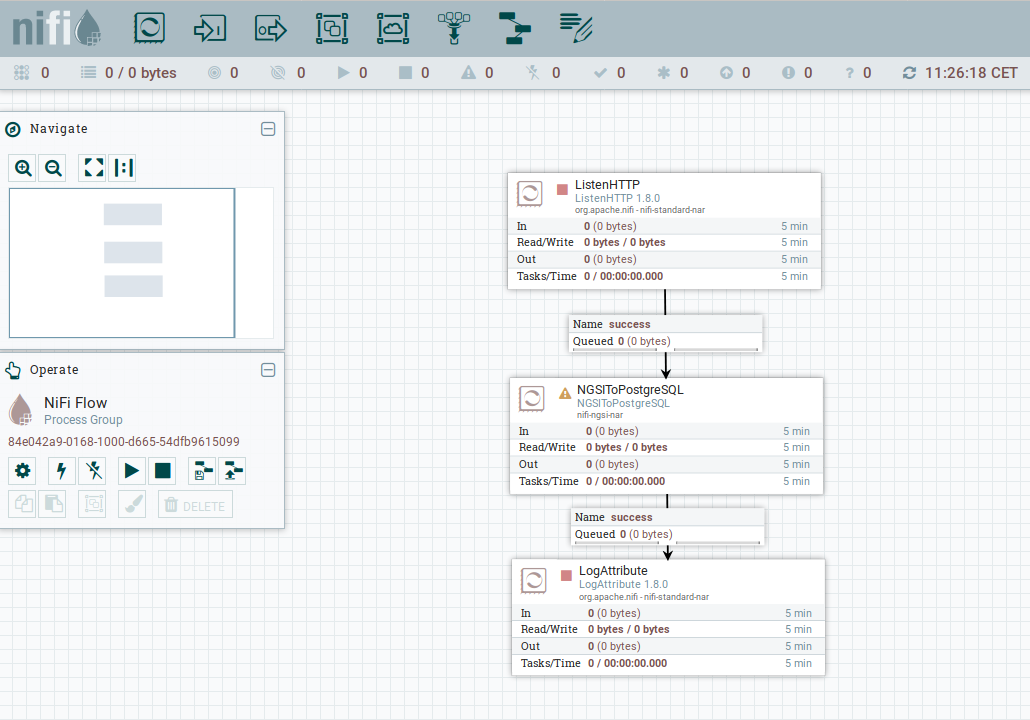
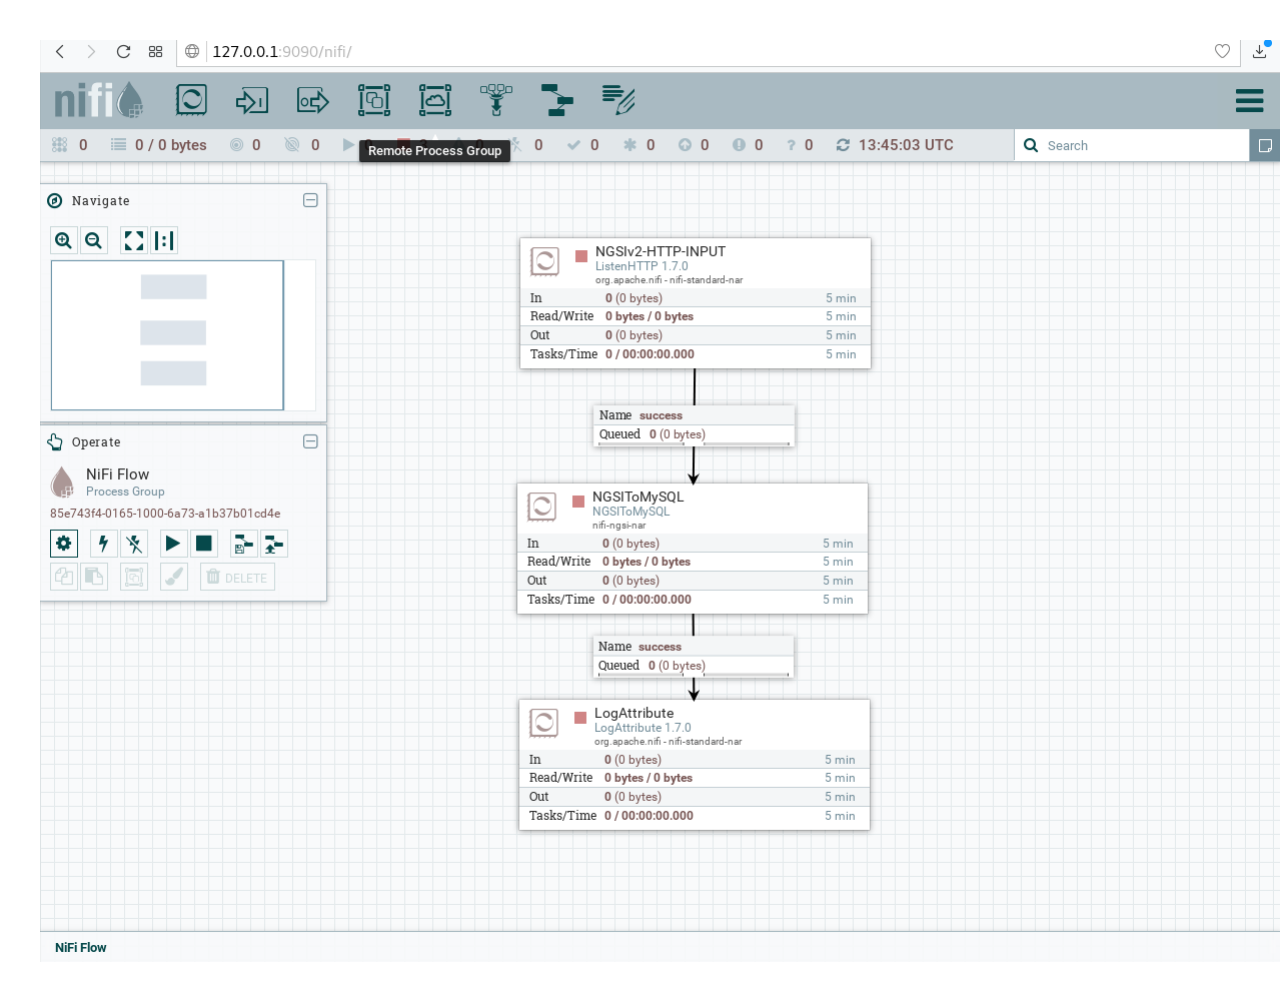
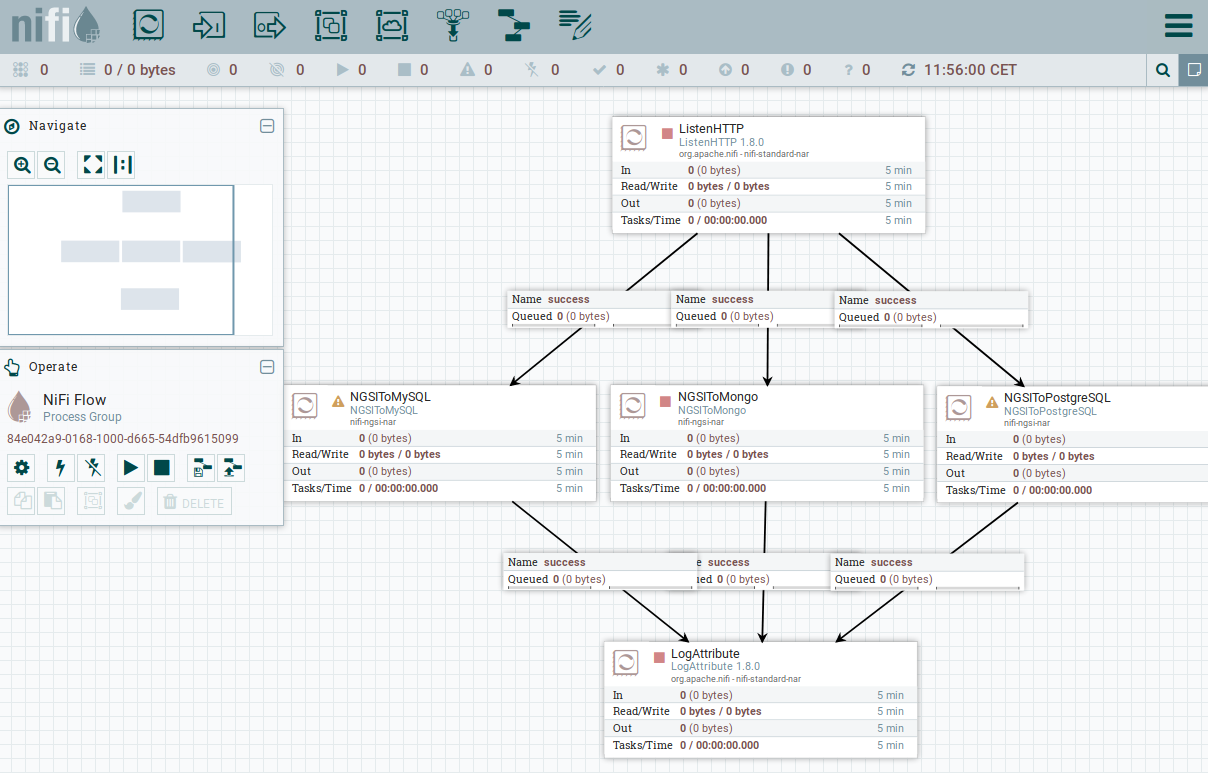
Now go to the Components toolbar which is placed in the upper section of the NiFi GUI, find the template icon and drag and drop it inside the Draco user space. At this point, a popup should be displayed with a list of all the templates available. Please select the template MONGO-TUTORIAL.
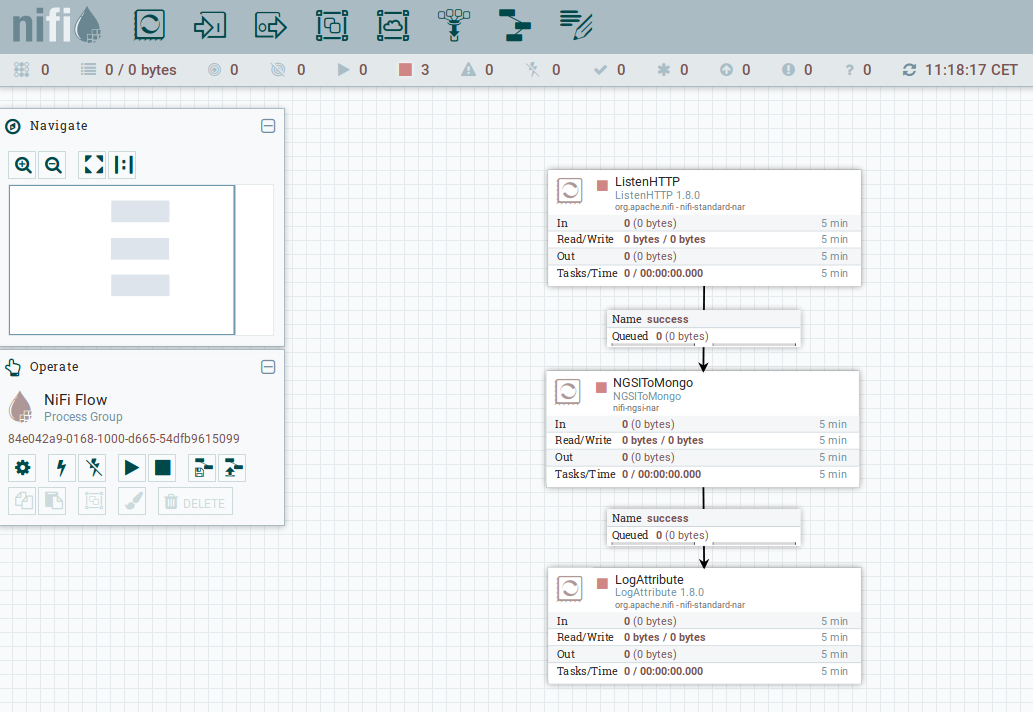
Select all the processors (press shift and click on every processor) and start them by clicking on the start button. Now, you can see that the status icon of each processor turned from red to green.
Checking the Draco Service Health
Once Draco is running, you can check the status by making an HTTP request to the exposed draco port to
/nifi-api/system-diagnostics. If the response is blank, this is usually because Draco is not running or is listening
on another port.
1 Request:
curl -X GET \
  'http://localhost:9090/nifi-api/system-diagnostics'
Response:
Tip: Use jq to format the JSON responses in this tutorial. Pipe the result by appending
| jq '.'
The response will look similar to the following:
{
    "systemDiagnostics": {
        "aggregateSnapshot": {
            "totalNonHeap": "185.66 MB",
            "totalNonHeapBytes": 194682880,
            "usedNonHeap": "175.44 MB",
            "usedNonHeapBytes": 183967304,
            "freeNonHeap": "10.22 MB",
            "freeNonHeapBytes": 10715576,
            "maxNonHeap": "-1 bytes",
            "maxNonHeapBytes": -1,
            "totalHeap": "477 MB",
            "totalHeapBytes": 500170752,
            "usedHeap": "183.07 MB",
            "usedHeapBytes": 191966680,
            "freeHeap": "293.93 MB",
            "freeHeapBytes": 308204072,
            "maxHeap": "477 MB",
            "maxHeapBytes": 500170752,
            "heapUtilization": "38.0%",
            "availableProcessors": 4,
            "processorLoadAverage": 0.24,
            "totalThreads": 65,
            "daemonThreads": 26,
            "uptime": "00:48:56.788",
            "flowFileRepositoryStorageUsage": {
                "freeSpace": "248.23 GB",
                "totalSpace": "285.7 GB",
                "usedSpace": "37.47 GB",
                "freeSpaceBytes": 266531205120,
                "totalSpaceBytes": 306767486976,
                "usedSpaceBytes": 40236281856,
                "utilization": "13.0%"
            },
            "contentRepositoryStorageUsage": [
                {
                    "identifier": "default",
                    "freeSpace": "248.23 GB",
                    "totalSpace": "285.7 GB",
                    "usedSpace": "37.47 GB",
                    "freeSpaceBytes": 266531205120,
                    "totalSpaceBytes": 306767486976,
                    "usedSpaceBytes": 40236281856,
                    "utilization": "13.0%"
                }
            ],
            "provenanceRepositoryStorageUsage": [
                {
                    "identifier": "default",
                    "freeSpace": "248.23 GB",
                    "totalSpace": "285.7 GB",
                    "usedSpace": "37.47 GB",
                    "freeSpaceBytes": 266531205120,
                    "totalSpaceBytes": 306767486976,
                    "usedSpaceBytes": 40236281856,
                    "utilization": "13.0%"
                }
            ],
            "garbageCollection": [
                {
                    "name": "PS Scavenge",
                    "collectionCount": 41,
                    "collectionTime": "00:00:01.131",
                    "collectionMillis": 1131
                },
                {
                    "name": "PS MarkSweep",
                    "collectionCount": 4,
                    "collectionTime": "00:00:00.529",
                    "collectionMillis": 529
                }
            ],
            "statsLastRefreshed": "09:20:15 UTC",
            "versionInfo": {
                "niFiVersion": "1.15.3",
                "javaVendor": "Oracle Corporation",
                "javaVersion": "1.8.0_322",
                "osName": "Linux",
                "osVersion": "5.15.49-linuxkit-pr",
                "osArchitecture": "amd64",
                "buildTag": "nifi-1.15.3-RC1",
                "buildRevision": "753c311",
                "buildBranch": "UNKNOWN",
                "buildTimestamp": "01/13/2022 11:15:46 UTC"
            }
        }
    }
}
Troubleshooting: What if the response is blank ?
- To check that a docker container is running try:
docker psYou should see several containers running. If
dracois not running, you can restart the containers as necessary.
Generating Context Data
For the purpose of this tutorial, we must be monitoring a system where the context is periodically being updated. The
dummy IoT Sensors can be used to do this. Open the device monitor page at http://localhost:3000/device/monitor and
unlock a Smart Door and switch on a Smart Lamp. This can be done by selecting an appropriate the command from
the drop-down list and pressing the send button. The stream of measurements coming from the devices can then be seen
on the same page:
Subscribing to Context Changes
Once a dynamic context system is up and running, we need to inform Draco of changes in context.
This is done by making a POST request to the /v2/subscription endpoint of the Orion Context Broker.
- The
fiware-serviceandfiware-servicepathheaders are used to filter the subscription to only listen to measurements from the attached IoT Sensors, since they had been provisioned using these settings. - The
idPatternin the request body ensures that Draco will be informed of all context data changes. - The notification
urlmust match the configuredBase Path and Listening portof the Draco Listen HTTP Processor - The
throttlingvalue defines the rate that changes are sampled.
2 Request:
curl -iX POST \
  'http://localhost:1026/v2/subscriptions' \
  -H 'Content-Type: application/json' \
  -H 'fiware-service: openiot' \
  -H 'fiware-servicepath: /' \
  -d '{
  "description": "Notify Draco of all context changes",
  "subject": {
    "entities": [
      {
        "idPattern": ".*"
      }
    ]
  },
  "notification": {
    "http": {
      "url": "http://draco:5050/v2/notify"
    }
  },
  "throttling": 5
}'
As you can see, the database used to persist context data has no impact on the details of the subscription. It is the same for each database. The response will be 201 - Created.
If a subscription has been created, you can check to see if it is firing by making a GET request to the
/v2/subscriptions endpoint.
3 Request:
curl -X GET \
  'http://localhost:1026/v2/subscriptions/' \
  -H 'fiware-service: openiot' \
  -H 'fiware-servicepath: /'
Response:
[
    {
        "id": "5b39d7c866df40ed84284174",
        "description": "Notify Draco of all context changes",
        "status": "active",
        "subject": {
            "entities": [
                {
                    "idPattern": ".*"
                }
            ],
            "condition": {
                "attrs": []
            }
        },
        "notification": {
            "timesSent": 158,
            "lastNotification": "2018-07-02T07:59:21.00Z",
            "attrs": [],
            "http": {
                "url": "http://draco:5050/v2/notify"
            },
            "lastSuccess": "2018-07-02T07:59:21.00Z"
        },
        "throttling": 5
    }
]
Within the notification section of the response, you can see several additional attributes which describe the health
of the subscription.
If the criteria of the subscription have been met, timesSent should be greater than 0. A zero value would indicate
that the subject of the subscription is incorrect or the subscription has created with the wrong fiware-service-path
or fiware-service header.
The lastNotification should be a recent timestamp - if this is not the case, then the devices are not regularly
sending data. Remember to unlock the Smart Door and switch on the Smart Lamp.
The lastSuccess should match the lastNotification date - if this is not the case then Draco is not receiving the
subscription properly. Check that the hostname and port are correct.
Finally, check that the status of the subscription is active - an expired subscription will not fire.
MongoDB - Reading Data from a database
To read MongoDB data from the command-line, we will need access to the mongo tool run an interactive instance of the
mongo image as shown to obtain a command-line prompt:
docker run -it --network fiware_default --entrypoint /bin/bash mongo
You can then log into to the running mongo-db database by using the command-line as shown:
mongosh --host mongo-db
Show Available Databases on the MongoDB server
To show the list of available databases, run the statement as shown:
Query:
show dbs
Result:
admin          0.000GB
iotagentjson     0.000GB
local          0.000GB
orion          0.000GB
orion-openiot  0.000GB
sth_openiot    0.000GB
The result include two databases admin and local which are set up by default by MongoDB, along with four
databases created by the FIWARE platform. The Orion Context Broker has created two separate database instance for each
fiware-service:
- The Store entities were created without defining a
fiware-serviceand therefore are held within theoriondatabase, whereas the IoT device entities were created using theopeniotfiware-serviceheader and are held separately. The IoT Agent was initialized to hold the IoT sensor data in a separate MongoDB database callediotagentjson.
As a result of the subscription of Draco to Orion Context Broker, a new database has been created called sth_openiot.
The default value for a Mongo DB database holding historic context consists of the sth_ prefix followed by the
fiware-service header - therefore sth_openiot holds the historic context of the IoT devices.
Read Historical Context from the server
Query:
use sth_openiot
show collections
Result:
switched to db sth_openiot

sth_/_Door:001_Door
sth_/_Door:001_Door.aggr
sth_/_Lamp:001_Lamp
sth_/_Lamp:001_Lamp.aggr
sth_/_Motion:001_Motion
sth_/_Motion:001_Motion.aggr
Looking within the sth_openiot you will see that a series of tables have been created. The names of each table consist
of the sth_ prefix followed by the fiware-servicepath header followed by the entity ID. Two table are created for
each entity - the .aggr table holds some aggregated data which will be accessed in a later tutorial. The raw data can
be seen in the tables without the .aggr suffix.
The historical data can be seen by looking at the data within each table, by default each row will contain the sampled value of a single attribute.
Query:
db["sth_/_Door:001_Door"].find().limit(10)
Result:
{ "_id" : ObjectId("5b1fa48630c49e0012f7635d"), "recvTime" : ISODate("2018-06-12T10:46:30.897Z"), "attrName" : "TimeInstant", "attrType" : "ISO8601", "attrValue" : "2018-06-12T10:46:30.836Z" }
{ "_id" : ObjectId("5b1fa48630c49e0012f7635e"), "recvTime" : ISODate("2018-06-12T10:46:30.897Z"), "attrName" : "close_status", "attrType" : "commandStatus", "attrValue" : "UNKNOWN" }
{ "_id" : ObjectId("5b1fa48630c49e0012f7635f"), "recvTime" : ISODate("2018-06-12T10:46:30.897Z"), "attrName" : "lock_status", "attrType" : "commandStatus", "attrValue" : "UNKNOWN" }
{ "_id" : ObjectId("5b1fa48630c49e0012f76360"), "recvTime" : ISODate("2018-06-12T10:46:30.897Z"), "attrName" : "open_status", "attrType" : "commandStatus", "attrValue" : "UNKNOWN" }
{ "_id" : ObjectId("5b1fa48630c49e0012f76361"), "recvTime" : ISODate("2018-06-12T10:46:30.836Z"), "attrName" : "refStore", "attrType" : "Relationship", "attrValue" : "Store:001" }
{ "_id" : ObjectId("5b1fa48630c49e0012f76362"), "recvTime" : ISODate("2018-06-12T10:46:30.836Z"), "attrName" : "state", "attrType" : "Text", "attrValue" : "CLOSED" }
{ "_id" : ObjectId("5b1fa48630c49e0012f76363"), "recvTime" : ISODate("2018-06-12T10:45:26.368Z"), "attrName" : "unlock_info", "attrType" : "commandResult", "attrValue" : " unlock OK" }
{ "_id" : ObjectId("5b1fa48630c49e0012f76364"), "recvTime" : ISODate("2018-06-12T10:45:26.368Z"), "attrName" : "unlock_status", "attrType" : "commandStatus", "attrValue" : "OK" }
{ "_id" : ObjectId("5b1fa4c030c49e0012f76385"), "recvTime" : ISODate("2018-06-12T10:47:28.081Z"), "attrName" : "TimeInstant", "attrType" : "ISO8601", "attrValue" : "2018-06-12T10:47:28.038Z" }
{ "_id" : ObjectId("5b1fa4c030c49e0012f76386"), "recvTime" : ISODate("2018-06-12T10:47:28.081Z"), "attrName" : "close_status", "attrType" : "commandStatus", "attrValue" : "UNKNOWN" }
The usual MongoDB query syntax can be used to filter appropriate fields and values. For example to read the rate at
which the Motion Sensor with the id=Motion:001_Motion is accumulating, you would make a query as follows:
Query:
db["sth_/_Motion:001_Motion"].find({attrName: "count"},{_id: 0, attrType: 0, attrName: 0 } ).limit(10)
Result:
{ "recvTime" : ISODate("2018-06-12T10:46:18.756Z"), "attrValue" : "8" }
{ "recvTime" : ISODate("2018-06-12T10:46:36.881Z"), "attrValue" : "10" }
{ "recvTime" : ISODate("2018-06-12T10:46:42.947Z"), "attrValue" : "11" }
{ "recvTime" : ISODate("2018-06-12T10:46:54.893Z"), "attrValue" : "13" }
{ "recvTime" : ISODate("2018-06-12T10:47:00.929Z"), "attrValue" : "15" }
{ "recvTime" : ISODate("2018-06-12T10:47:06.954Z"), "attrValue" : "17" }
{ "recvTime" : ISODate("2018-06-12T10:47:15.983Z"), "attrValue" : "19" }
{ "recvTime" : ISODate("2018-06-12T10:47:49.090Z"), "attrValue" : "23" }
{ "recvTime" : ISODate("2018-06-12T10:47:58.112Z"), "attrValue" : "25" }
{ "recvTime" : ISODate("2018-06-12T10:48:28.218Z"), "attrValue" : "29" }
To leave the MongoDB client and leave interactive mode, run the following:
exit
exit
PostgreSQL - Persisting Context Data into a Database
To persist historic context data into an alternative database such as PostgreSQL, we will need an additional
container which hosts the PostgreSQL server - the default Docker image for this data can be used. The PostgreSQL
instance is listening on the standard 5432 port and the overall architecture can be seen below:

We now have a system with two databases, since the MongoDB container is still required to hold data related to the Orion Context Broker and the IoT Agent.
PostgreSQL - Database Server Configuration
postgres-db:
    image: postgres:latest
    hostname: postgres-db
    container_name: db-postgres
    expose:
        - '5432'
    ports:
        - '5432:5432'
    networks:
        - default
    environment:
        - 'POSTGRES_PASSWORD=password'
        - 'POSTGRES_USER=postgres'
        - 'POSTGRES_DB=postgres'
The postgres-db container is listening on a single port:
- Port
5432is the default port for a PostgreSQL server. It has been exposed, so you can also run thepgAdmin4tool to display database data if you wish.
The postgres-db container is driven by environment variables as shown:
| Key | Value. | Description |
|---|---|---|
| POSTGRES_PASSWORD | password |
Password for the PostgreSQL database user |
| POSTGRES_USER | postgres |
Username for the PostgreSQL database user |
| POSTGRES_DB | postgres |
The name of the PostgreSQL database |
Note: Passing the Username and Password in plain text environment variables like this is a security risk. Whereas this is acceptable practice in a tutorial, for a production environment, you can avoid this risk by applying Docker Secrets
PostgreSQL - Draco Configuration
draco:
    image: ging/fiware-draco:1.1.0
    container_name: draco
    depends_on:
        - postgres-db
    environment:
        - NIFI_WEB_HTTP_PORT=9090
    ports:
        - '9090:9090'
        - '5050:5050'
    healthcheck:
        test: curl --fail -s http://localhost:9090/nifi-api/system-diagnostics || exit 1
The draco container is listening on two ports:
- The Subscription Port for Draco -
5050is where the service will be listening for notifications from the Orion context broker. - The Web interface for Draco -
9090is exposed purely for configuring the processors.
PostgreSQL - Start up
To start the system with a PostgreSQL database run the following command:
./services postgres
Then go to your browser and open Draco using this URL http://localhost:9090/nifi
Now go to the Components toolbar which is placed in the upper section of the NiFi GUI, find the template icon and drag and drop it inside the Draco user space. At this point, a popup should be displayed with a list of all the templates available. Please select the template POSTGRESQL-TUTORIAL.
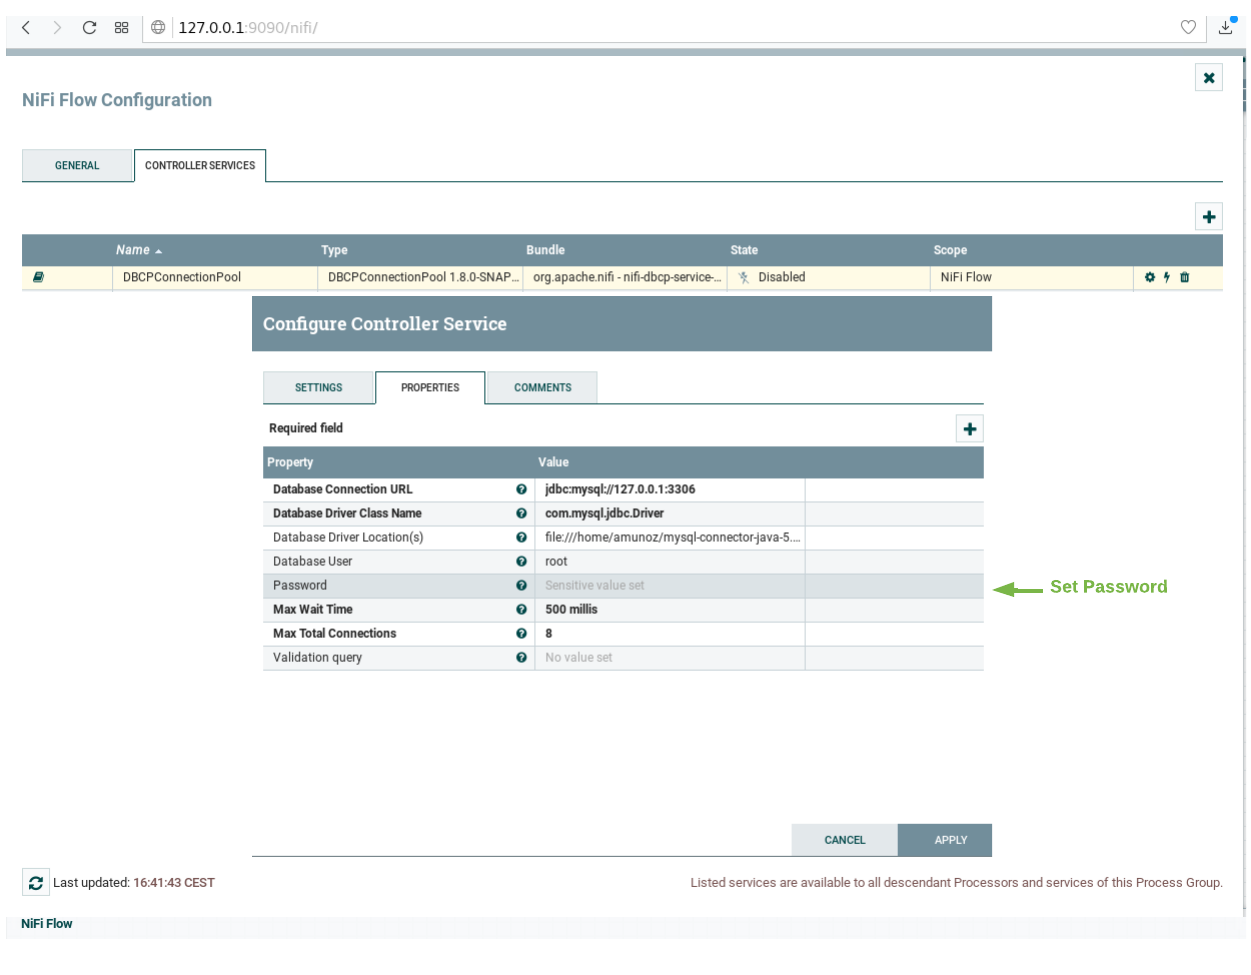
Before starting the processors, you need to set your PostgreSQL password and enable the DBCConnectionPool controller. For doing that please follow the instructions:
-
Do right click on any part of the Draco GUI user space, and then click on configure.
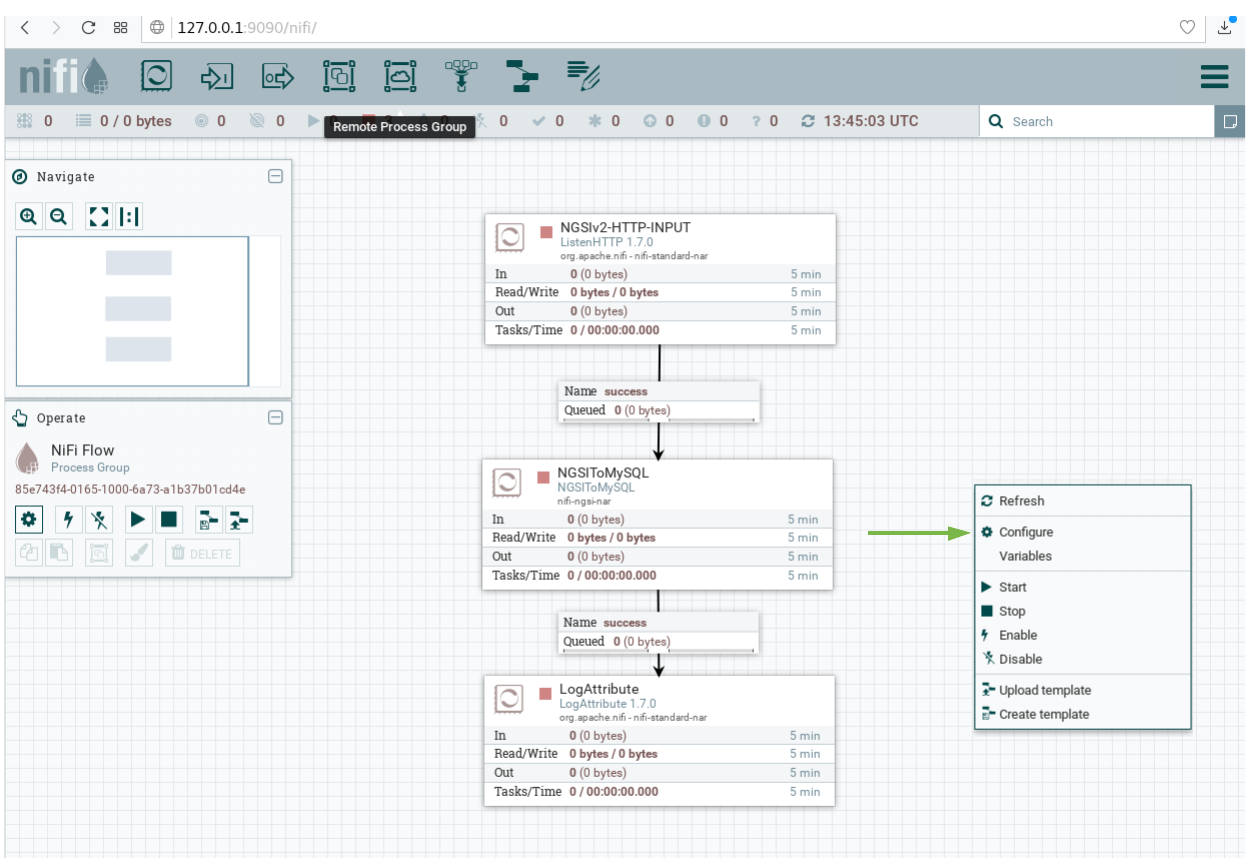
-
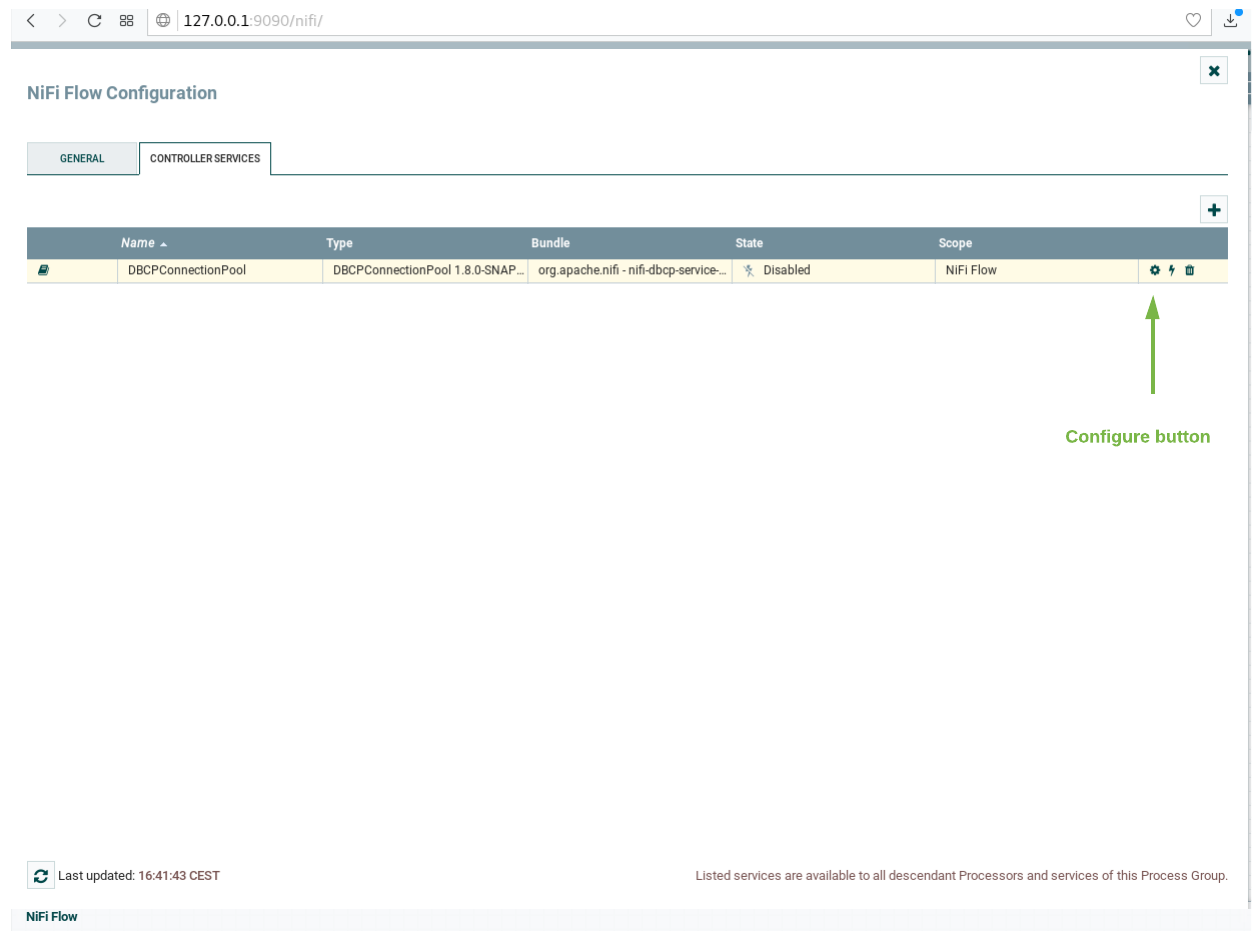
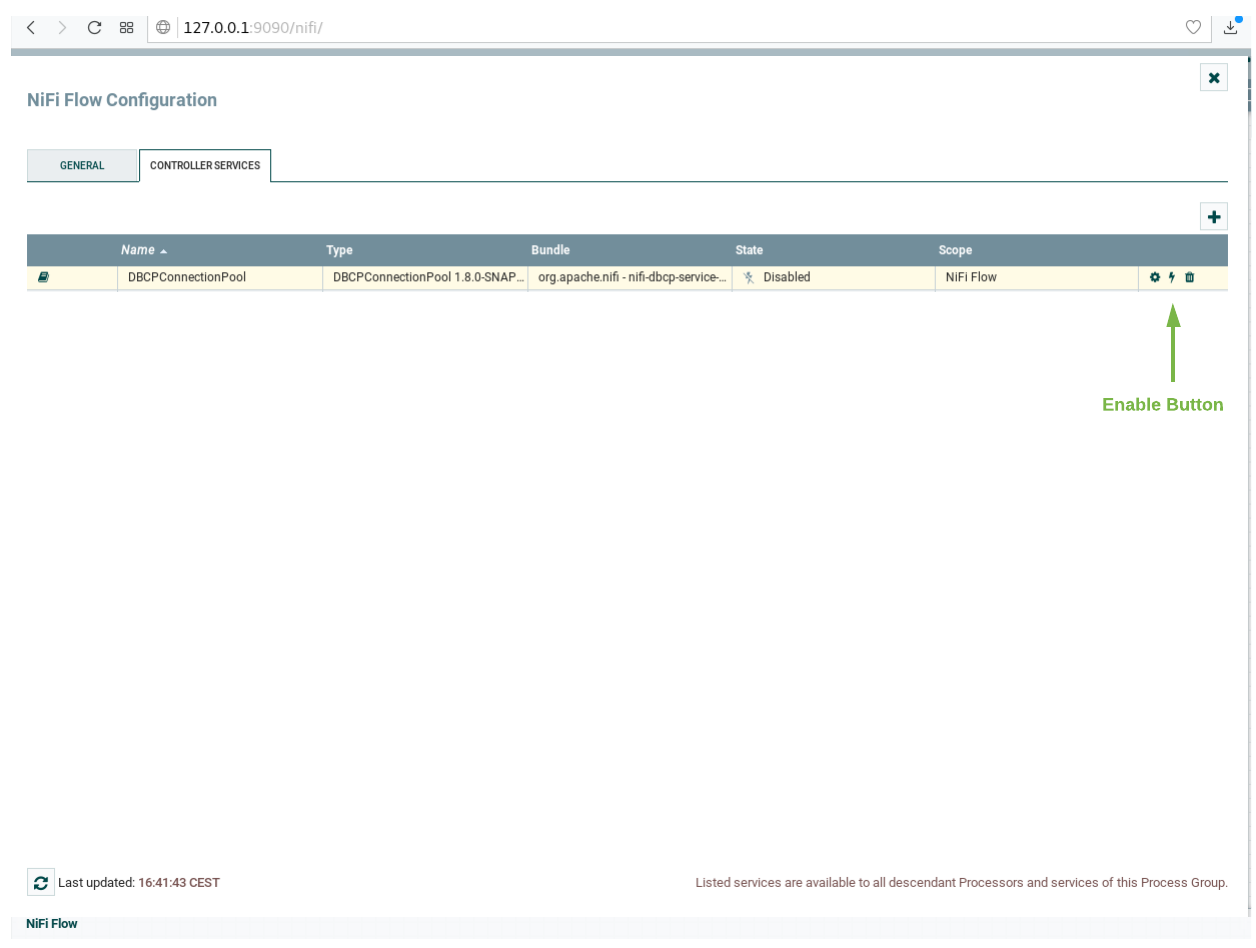
Go to the Controller Services Tab, at this point a list of controllers should be displayed, locate the DBCConnectionPool controller.
-
Click on the configuration button of the "DBCPConnectionPool".
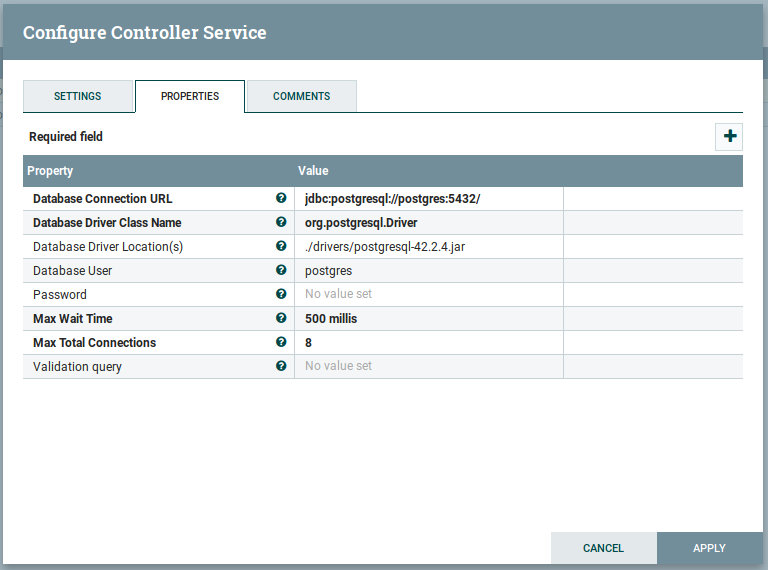
-
Go to the controller Properties tab and put "password" in the password field, then apply the changes.
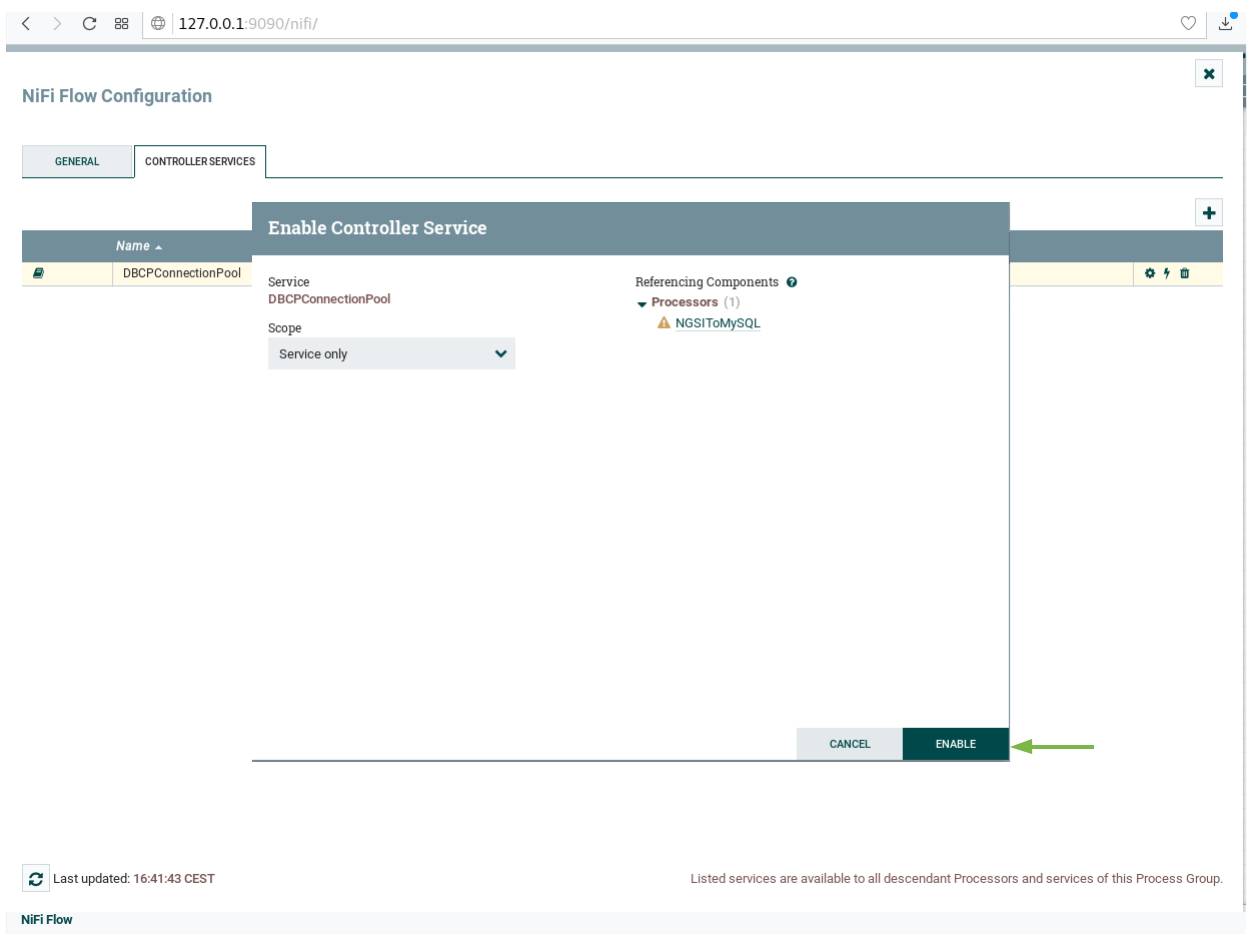
-
Enable the processor by clicking on the thunder icon and then click on enable, then close the controller configuration page.
-
Select all the processors (press shift and click on every processor) and start them by clicking on the start button. Now, you can see that the status icon of each processor turned from red to green.
Checking the Draco Service Health
Once Draco is running, you can check the status by making an HTTP request to the exposed draco port to
/nifi-api/system-diagnostics. If the response is blank, this is usually because Draco is not running or is listening
on another port.
4 Request:
curl -X GET \
  'http://localhost:9090/nifi-api/system-diagnostics'
Response:
The response will look similar to the following:
{
    "systemDiagnostics": {
        "aggregateSnapshot": {
            "totalNonHeap": "185.66 MB",
            "totalNonHeapBytes": 194682880,
            "usedNonHeap": "175.44 MB",
            "usedNonHeapBytes": 183967304,
            "freeNonHeap": "10.22 MB",
            "freeNonHeapBytes": 10715576,
            "maxNonHeap": "-1 bytes",
            "maxNonHeapBytes": -1,
            "totalHeap": "477 MB",
            "totalHeapBytes": 500170752,
            "usedHeap": "183.07 MB",
            "usedHeapBytes": 191966680,
            "freeHeap": "293.93 MB",
            "freeHeapBytes": 308204072,
            "maxHeap": "477 MB",
            "maxHeapBytes": 500170752,
            "heapUtilization": "38.0%",
            "availableProcessors": 4,
            "processorLoadAverage": 0.24,
            "totalThreads": 65,
            "daemonThreads": 26,
            "uptime": "00:48:56.788",
            "flowFileRepositoryStorageUsage": {
                "freeSpace": "248.23 GB",
                "totalSpace": "285.7 GB",
                "usedSpace": "37.47 GB",
                "freeSpaceBytes": 266531205120,
                "totalSpaceBytes": 306767486976,
                "usedSpaceBytes": 40236281856,
                "utilization": "13.0%"
            },
            "contentRepositoryStorageUsage": [
                {
                    "identifier": "default",
                    "freeSpace": "248.23 GB",
                    "totalSpace": "285.7 GB",
                    "usedSpace": "37.47 GB",
                    "freeSpaceBytes": 266531205120,
                    "totalSpaceBytes": 306767486976,
                    "usedSpaceBytes": 40236281856,
                    "utilization": "13.0%"
                }
            ],
            "provenanceRepositoryStorageUsage": [
                {
                    "identifier": "default",
                    "freeSpace": "248.23 GB",
                    "totalSpace": "285.7 GB",
                    "usedSpace": "37.47 GB",
                    "freeSpaceBytes": 266531205120,
                    "totalSpaceBytes": 306767486976,
                    "usedSpaceBytes": 40236281856,
                    "utilization": "13.0%"
                }
            ],
            "garbageCollection": [
                {
                    "name": "PS Scavenge",
                    "collectionCount": 41,
                    "collectionTime": "00:00:01.131",
                    "collectionMillis": 1131
                },
                {
                    "name": "PS MarkSweep",
                    "collectionCount": 4,
                    "collectionTime": "00:00:00.529",
                    "collectionMillis": 529
                }
            ],
            "statsLastRefreshed": "09:20:15 UTC",
            "versionInfo": {
                "niFiVersion": "1.15.3",
                "javaVendor": "Oracle Corporation",
                "javaVersion": "1.8.0_322",
                "osName": "Linux",
                "osVersion": "5.15.49-linuxkit-pr",
                "osArchitecture": "amd64",
                "buildTag": "nifi-1.15.3-RC1",
                "buildRevision": "753c311",
                "buildBranch": "UNKNOWN",
                "buildTimestamp": "01/13/2022 11:15:46 UTC"
            }
        }
    }
}
Troubleshooting: What if the response is blank ?
- To check that a docker container is running try
docker psYou should see several containers running. If
dracois not running, you can restart the containers as necessary.
Generating Context Data
For the purpose of this tutorial, we must be monitoring a system where the context is periodically being updated. The
dummy IoT Sensors can be used to do this. Open the device monitor page at http://localhost:3000/device/monitor and
unlock a Smart Door and switch on a Smart Lamp. This can be done by selecting an appropriate the command from
the drop-down list and pressing the send button. The stream of measurements coming from the devices can then be seen
on the same page:
Subscribing to Context Changes
Once a dynamic context system is up and running, we need to inform Draco of changes in context.
This is done by making a POST request to the /v2/subscription endpoint of the Orion Context Broker.
- The
fiware-serviceandfiware-servicepathheaders are used to filter the subscription to only listen to measurements from the attached IoT Sensors, since they had been provisioned using these settings. - The
idPatternin the request body ensures that Draco will be informed of all context data changes. - The
throttlingvalue defines the rate that changes are sampled.
5 Request:
curl -iX POST \
  'http://localhost:1026/v2/subscriptions' \
  -H 'Content-Type: application/json' \
  -H 'fiware-service: openiot' \
  -H 'fiware-servicepath: /' \
  -d '{
  "description": "Notify Draco of all context changes",
  "subject": {
    "entities": [
      {
        "idPattern": ".*"
      }
    ]
  },
  "notification": {
    "http": {
      "url": "http://draco:5050/v2/notify"
    }
  },
  "throttling": 5
}'
As you can see, the database used to persist context data has no impact on the details of the subscription. It is the same for each database. The response will be 201 - Created.
PostgreSQL - Reading Data from a database
To read PostgreSQL data from the command-line, we will need access to the postgres client, to do this, run an
interactive instance of the postgresql-client image supplying the connection string as shown to obtain a command-line
prompt:
docker run -it --rm  --network fiware_default jbergknoff/postgresql-client \
   postgresql://postgres:password@postgres-db:5432/postgres
Show Available Databases on the PostgreSQL server
To show the list of available databases, run the statement as shown:
Query:
\list
Result:
   Name    |  Owner   | Encoding |  Collate   |   Ctype    |   Access privileges
-----------+----------+----------+------------+------------+-----------------------
 postgres  | postgres | UTF8     | en_US.utf8 | en_US.utf8 |
 template0 | postgres | UTF8     | en_US.utf8 | en_US.utf8 | =c/postgres          +
           |          |          |            |            | postgres=CTc/postgres
 template1 | postgres | UTF8     | en_US.utf8 | en_US.utf8 | =c/postgres          +
           |          |          |            |            | postgres=CTc/postgres
(3 rows)
The result include two template databases template0 and template1 as well as the postgres database setup when the
docker container was started.
To show the list of available schemas, run the statement as shown:
Query:
\dn
Result:
  List of schemas
  Name   |  Owner
---------+----------
 openiot | postgres
 public  | postgres
(2 rows)
As a result of the subscription of Draco to Orion Context Broker, a new schema has been created called openiot. The
name of the schema matches the fiware-service header - therefore openiot holds the historic context of the IoT
devices.
Read Historical Context from the PostgreSQL server
Once running a docker container within the network, it is possible to obtain information about the running database.
Query:
SELECT table_schema,table_name
FROM information_schema.tables
WHERE table_schema ='openiot'
ORDER BY table_schema,table_name;
Result:
 table_schema |    table_name
--------------+-------------------
 openiot      | door_001_door
 openiot      | lamp_001_lamp
 openiot      | motion_001_motion
(3 rows)
The table_schema matches the fiware-service header supplied with the context data.
To read the data within a table, run a select statement as shown:
Query:
SELECT * FROM openiot.motion_001_motion limit 10;
Result:
  recvtimets   |         recvtime         | fiwareservicepath |  entityid  | entitytype |  attrname   |   attrtype   |        attrvalue         |                                    attrmd
---------------+--------------------------+-------------------+------------+------------+-------------+--------------+--------------------------+------------------------------------------------------------------------------
 1528803005491 | 2018-06-12T11:30:05.491Z | /                 | Motion:001 | Motion     | TimeInstant | ISO8601      | 2018-06-12T11:30:05.423Z | []
 1528803005491 | 2018-06-12T11:30:05.491Z | /                 | Motion:001 | Motion     | count       | Integer      | 7                        | [{"name":"TimeInstant","type":"ISO8601","value":"2018-06-12T11:30:05.423Z"}]
 1528803005491 | 2018-06-12T11:30:05.491Z | /                 | Motion:001 | Motion     | refStore    | Relationship | Store:001                | [{"name":"TimeInstant","type":"ISO8601","value":"2018-06-12T11:30:05.423Z"}]
 1528803035501 | 2018-06-12T11:30:35.501Z | /                 | Motion:001 | Motion     | TimeInstant | ISO8601      | 2018-06-12T11:30:35.480Z | []
 1528803035501 | 2018-06-12T11:30:35.501Z | /                 | Motion:001 | Motion     | count       | Integer      | 10                       | [{"name":"TimeInstant","type":"ISO8601","value":"2018-06-12T11:30:35.480Z"}]
 1528803035501 | 2018-06-12T11:30:35.501Z | /                 | Motion:001 | Motion     | refStore    | Relationship | Store:001                | [{"name":"TimeInstant","type":"ISO8601","value":"2018-06-12T11:30:35.480Z"}]
 1528803041563 | 2018-06-12T11:30:41.563Z | /                 | Motion:001 | Motion     | TimeInstant | ISO8601      | 2018-06-12T11:30:41.520Z | []
 1528803041563 | 2018-06-12T11:30:41.563Z | /                 | Motion:001 | Motion     | count       | Integer      | 12                       | [{"name":"TimeInstant","type":"ISO8601","value":"2018-06-12T11:30:41.520Z"}]
 1528803041563 | 2018-06-12T11:30:41.563Z | /                 | Motion:001 | Motion     | refStore    | Relationship | Store:001                | [{"name":"TimeInstant","type":"ISO8601","value":"2018-06-12T11:30:41.520Z"}]
 1528803047545 | 2018-06-12T11:30:47.545Z | /
The usual PostgreSQL query syntax can be used to filter appropriate fields and values. For example to read the rate
at which the Motion Sensor with the id=Motion:001_Motion is accumulating, you would make a query as follows:
Query:
SELECT recvtime, attrvalue FROM openiot.motion_001_motion WHERE attrname ='count' limit 10;
Result:
         recvtime         | attrvalue
--------------------------+-----------
 2018-06-12T11:30:05.491Z | 7
 2018-06-12T11:30:35.501Z | 10
 2018-06-12T11:30:41.563Z | 12
 2018-06-12T11:30:47.545Z | 13
 2018-06-12T11:31:02.617Z | 15
 2018-06-12T11:31:32.718Z | 20
 2018-06-12T11:31:38.733Z | 22
 2018-06-12T11:31:50.780Z | 24
 2018-06-12T11:31:56.825Z | 25
 2018-06-12T11:31:59.790Z | 26
(10 rows)
To leave the Postgres client and leave interactive mode, run the following:
\q
You will then return to the command-line.
MySQL - Persisting Context Data into a Database
Similarly, to persisting historic context data into MySQL, we will again need an additional container which hosts
the MySQL server, once again the default Docker image for this data can be used. The MySQL instance is listening on the
standard 3306 port and the overall architecture can be seen below:
Once again we have a system with two databases, since the MongoDB container is still required to hold data related to the Orion Context Broker and the IoT Agent.
MySQL - Database Server Configuration
mysql-db:
    restart: always
    image: mysql:5.7
    hostname: mysql-db
    container_name: db-mysql
    expose:
        - '3306'
    ports:
        - '3306:3306'
    networks:
        - default
    environment:
        - 'MYSQL_ROOT_PASSWORD=123'
        - 'MYSQL_ROOT_HOST=%'
Note: Using the default
rootuser and displaying the password in an environment variables like this is a security risk. Whereas this is acceptable practice in a tutorial, for a production environment, you can avoid this risk by setting up another user and applying Docker Secrets
The mysql-db container is listening on a single port:
- Port
3306is the default port for a MySQL server. It has been exposed so you can also run other database tools to display data if you wish,
The mysql-db container is driven by environment variables as shown:
| Key | Value. | Description |
|---|---|---|
| MYSQL_ROOT_PASSWORD | 123. |
specifies a password that is set for the MySQL root account. |
| MYSQL_ROOT_HOST | % |
By default, MySQL creates the root'@'localhost account. This account can only be connected to from inside the container. Setting this environment variable allows root connections from other hosts |
MySQL - Draco Configuration
draco:
    image: ging/fiware-draco:1.1.0
    container_name: draco
    depends_on:
        - mysql-db
    environment:
        - NIFI_WEB_HTTP_PORT=9090
    ports:
        - '9090:9090'
        - '5050:5050'
    healthcheck:
        test: curl --fail -s http://localhost:9090/nifi-api/system-diagnostics || exit 1
The draco container is listening on two ports:
- The Subscription Port for Draco -
5050is where the service will be listening for notifications from the Orion context broker. - The Web interface for Draco -
9090is exposed purely for configuring the processors.
MySQL - Start up
To start the system with a MySQL database run the following command:
./services mysql
Then go to your browser and open Draco using this URL http://localhost:9090/nifi
Now go to the Components toolbar which is placed in the upper section of the NiFi GUI, find the template icon and drag and drop it inside the Draco user space. At this point, a popup should be displayed with a list of all the templates available. Please select the template MYSQL-TUTORIAL.
Before starting the processors, you need to set your MySQL password and enable the DBCConnectionPool controller. For doing that please follow the instructions:
-
Do right click on any part of the Draco GUI user space, and then click on configure.
-
Go to the Controller Services Tab, at this point a list of controllers should be displayed, locate the DBCConnectionPool controller.
-
Click on the configuration button of the "DBCPConnectionPool"
-
Go to the controller Properties tab and put "123" in the password field, then apply the changes.
-
Enable the processor by clicking on the thunder icon and then click on enable, then close the controller configuration page.
-
Select all the processors (press shift and click on every processor) and start them by clicking on the start button. Now, you can see that the status icon of each processor turned from red to green.
Checking the Draco Service Health
Once Draco is running, you can check the status by making an HTTP request to the exposed draco port to
/system-diagnostics. If the response is blank, this is usually because Draco is not running or is listening on another
port.
6 Request:
curl -X GET \
  'http://localhost:9090/nifi-api/system-diagnostics'
Response:
The response will look similar to the following:
{
    "systemDiagnostics": {
        "aggregateSnapshot": {
            "totalNonHeap": "value",
            "totalNonHeapBytes": 0,
            "usedNonHeap": "value",
            "usedNonHeapBytes": 0,
            "freeNonHeap": "value",
            "freeNonHeapBytes": 0,
            "maxNonHeap": "value",
            "maxNonHeapBytes": 0,
            "nonHeapUtilization": "value",
            "totalHeap": "value",
            "totalHeapBytes": 0,
            "usedHeap": "value",
            "usedHeapBytes": 0,
            "freeHeap": "value",
            "freeHeapBytes": 0,
            "maxHeap": "value",
            "maxHeapBytes": 0,
            "heapUtilization": "value",
            "availableProcessors": 0,
            "processorLoadAverage": 0.0,
            "totalThreads": 0,
            "daemonThreads": 0,
            "uptime": "value",
            "flowFileRepositoryStorageUsage": {},
            "contentRepositoryStorageUsage": [{}],
            "provenanceRepositoryStorageUsage": [{}],
            "garbageCollection": [{}],
            "statsLastRefreshed": "value",
            "versionInfo": {}
        },
        "nodeSnapshots": [{}]
    }
}
Troubleshooting: What if the response is blank ?
- To check that a docker container is running try
docker psYou should see several containers running. If
dracois not running, you can restart the containers as necessary.
Generating Context Data
For the purpose of this tutorial, we must be monitoring a system where the context is periodically being updated. The
dummy IoT Sensors can be used to do this. Open the device monitor page at http://localhost:3000/device/monitor and
unlock a Smart Door and switch on a Smart Lamp. This can be done by selecting an appropriate the command from
the drop-down list and pressing the send button. The stream of measurements coming from the devices can then be seen
on the same page:
Subscribing to Context Changes
Once a dynamic context system is up and running, we need to inform Draco of changes in context.
This is done by making a POST request to the /v2/subscription endpoint of the Orion Context Broker.
- The
fiware-serviceandfiware-servicepathheaders are used to filter the subscription to only listen to measurements from the attached IoT Sensors, since they had been provisioned using these settings. - The
idPatternin the request body ensures that Draco will be informed of all context data changes. - The
throttlingvalue defines the rate that changes are sampled.
7 Request:
curl -iX POST \
  'http://localhost:1026/v2/subscriptions' \
  -H 'Content-Type: application/json' \
  -H 'fiware-service: openiot' \
  -H 'fiware-servicepath: /' \
  -d '{
  "description": "Notify Draco of all context changes",
  "subject": {
    "entities": [
      {
        "idPattern": ".*"
      }
    ]
  },
  "notification": {
    "http": {
      "url": "http://draco:5050/v2/notify"
    }
  },
  "throttling": 5
}'
As you can see, the database used to persist context data has no impact on the details of the subscription. It is the same for each database. The response will be 201 - Created.
MySQL - Reading Data from a database
To read MySQL data from the command-line, we will need access to the mysql client, to do this, run an interactive
instance of the mysql image supplying the connection string as shown to obtain a command-line prompt:
docker exec -it db-mysql mysql -h mysql-db -P 3306 -u root -p123
Show Available Databases on the MySQL server
To show the list of available databases, run the statement as shown:
Query:
SHOW DATABASES;
Result:
+--------------------+
| Database           |
+--------------------+
| information_schema |
| mysql              |
| openiot            |
| performance_schema |
| sys                |
+--------------------+
5 rows in set (0.00 sec)
To show the list of available schemas, run the statement as shown:
Query:
SHOW SCHEMAS;
Result:
+--------------------+
| Database           |
+--------------------+
| information_schema |
| mysql              |
| openiot            |
| performance_schema |
| sys                |
+--------------------+
5 rows in set (0.00 sec)
As a result of the subscription of Draco to Orion Context Broker, a new schema has been created called openiot. The
name of the schema matches the fiware-service header - therefore openiot holds the historic context of the IoT
devices.
Read Historical Context from the MySQL server
Once running a docker container within the network, it is possible to obtain information about the running database.
Query:
SHOW tables FROM openiot;
Result:
 table_schema |    table_name
--------------+-------------------
 openiot      | door_001_door
 openiot      | lamp_001_lamp
 openiot      | motion_001_motion
(3 rows)
The table_schema matches the fiware-service header supplied with the context data.
To read the data within a table, run a select statement as shown:
Query:
SELECT * FROM openiot.Motion_001_Motion limit 10;
Result:
+---------------+-------------------------+-------------------+------------+------------+-------------+--------------+--------------------------+------------------------------------------------------------------------------+
| recvTimeTs    | recvTime                | fiwareServicePath | entityId   | entityType | attrName    | attrType     | attrValue                | attrMd                                                                       |
+---------------+-------------------------+-------------------+------------+------------+-------------+--------------+--------------------------+------------------------------------------------------------------------------+
| 1528804397955 | 2018-06-12T11:53:17.955 | /                 | Motion:001 | Motion     | TimeInstant | ISO8601      | 2018-06-12T11:53:17.923Z | []                                                                           |
| 1528804397955 | 2018-06-12T11:53:17.955 | /                 | Motion:001 | Motion     | count       | Integer      | 3                        | [{"name":"TimeInstant","type":"ISO8601","value":"2018-06-12T11:53:17.923Z"}] |
| 1528804397955 | 2018-06-12T11:53:17.955 | /                 | Motion:001 | Motion     | refStore    | Relationship | Store:001                | [{"name":"TimeInstant","type":"ISO8601","value":"2018-06-12T11:53:17.923Z"}] |
| 1528804403954 | 2018-06-12T11:53:23.954 | /                 | Motion:001 | Motion     | TimeInstant | ISO8601      | 2018-06-12T11:53:23.928Z | []                                                                           |
| 1528804403954 | 2018-06-12T11:53:23.954 | /                 | Motion:001 | Motion     | count       | Integer      | 5                        | [{"name":"TimeInstant","type":"ISO8601","value":"2018-06-12T11:53:23.928Z"}] |
| 1528804403954 | 2018-06-12T11:53:23.954 | /                 | Motion:001 | Motion     | refStore    | Relationship | Store:001                | [{"name":"TimeInstant","type":"ISO8601","value":"2018-06-12T11:53:23.928Z"}] |
| 1528804409970 | 2018-06-12T11:53:29.970 | /                 | Motion:001 | Motion     | TimeInstant | ISO8601      | 2018-06-12T11:53:29.948Z | []                                                                           |
| 1528804409970 | 2018-06-12T11:53:29.970 | /                 | Motion:001 | Motion     | count       | Integer      | 7                        | [{"name":"TimeInstant","type":"ISO8601","value":"2018-06-12T11:53:29.948Z"}] |
| 1528804409970 | 2018-06-12T11:53:29.970 | /                 | Motion:001 | Motion     | refStore    | Relationship | Store:001                | [{"name":"TimeInstant","type":"ISO8601","value":"2018-06-12T11:53:29.948Z"}] |
| 1528804446083 | 2018-06-12T11:54:06.83  | /                 | Motion:001 | Motion     | TimeInstant | ISO8601      | 2018-06-12T11:54:06.062Z | []                                                                           |
+---------------+-------------------------+-------------------+------------+------------+-------------+--------------+--------------------------+------------------------------------------------------------------------------+
The usual MySQL query syntax can be used to filter appropriate fields and values. For example to read the rate at
which the Motion Sensor with the id=Motion:001_Motion is accumulating, you would make a query as follows:
Query:
SELECT recvtime, attrvalue FROM openiot.Motion_001_Motion WHERE attrname ='count' LIMIT 10;
Result:
+-------------------------+-----------+
| recvtime                | attrvalue |
+-------------------------+-----------+
| 2018-06-12T11:53:17.955 | 3         |
| 2018-06-12T11:53:23.954 | 5         |
| 2018-06-12T11:53:29.970 | 7         |
| 2018-06-12T11:54:06.83  | 12        |
| 2018-06-12T11:54:12.132 | 13        |
| 2018-06-12T11:54:24.177 | 14        |
| 2018-06-12T11:54:36.196 | 16        |
| 2018-06-12T11:54:42.195 | 18        |
| 2018-06-12T11:55:24.300 | 23        |
| 2018-06-12T11:55:30.350 | 25        |
+-------------------------+-----------+
10 rows in set (0.00 sec)
To leave the MySQL client and leave interactive mode, run the following:
\q
You will then return to the command-line.
Multi-Agent - Persisting Context Data into a multiple Databases
It is also possible to configure Draco to populate multiple databases simultaneously. We can combine the architecture from the three previous examples and configure Draco to store data in multiple sinks.
We now have a system with three databases, PostgreSQL and MySQL for data persistence and MongoDB for both data persistence and holding data related to the Orion Context Broker and the IoT Agent.
Multi-Agent - Draco Configuration for Multiple Databases
draco:
    image: ging/fiware-draco:1.1.0
    container_name: draco
    depends_on:
        - mysql-db
        - mongo-db
        - postgres-db
    environment:
        - NIFI_WEB_HTTP_PORT=9090
    ports:
        - '9090:9090'
        - '5050:5050'
    healthcheck:
        test: curl --fail -s http://localhost:9090/nifi-api/system-diagnostics || exit 1
The draco container is listening on two ports:
- The Subscription Port for Draco -
5050is where the service will be listening for notifications from the Orion context broker. - The Web interface for Draco -
9090is exposed purely for configuring the processors.
Multi-Agent - Start up
To start the system with multiple databases run the following command:
./services multiple
Then go to your browser and open Draco using this URL http://localhost:9090/nifi
Now go to the Components toolbar which is placed in the upper section of the NiFi GUI, find the template icon and drag and drop it inside the Draco user space. At this point, a popup should be displayed with a list of all the templates available. Please select the template MULTIPLE-SINKS-TUTORIAL.
Now repeat the process for setting the password in the controller "DBCPConnectionPool" each connection MySQL and PostgreSQL.
Select all the processors (press shift and click on every processor) and start them by clicking on the start button. Now, you can see that the status icon of each processor turned from red to green.
Checking the Draco Service Health
Once Draco is running, you can check the status by making an HTTP request to the exposed draco port to
/system-diagnostics. If the response is blank, this is usually because Draco is not running or is listening on another
port.
8 Request:
curl -X GET \
  'http://localhost:9090/nifi-api/system-diagnostics'
Response:
The response will look similar to the following:
{
    "systemDiagnostics": {
        "aggregateSnapshot": {
            "totalNonHeap": "value",
            "totalNonHeapBytes": 0,
            "usedNonHeap": "value",
            "usedNonHeapBytes": 0,
            "freeNonHeap": "value",
            "freeNonHeapBytes": 0,
            "maxNonHeap": "value",
            "maxNonHeapBytes": 0,
            "nonHeapUtilization": "value",
            "totalHeap": "value",
            "totalHeapBytes": 0,
            "usedHeap": "value",
            "usedHeapBytes": 0,
            "freeHeap": "value",
            "freeHeapBytes": 0,
            "maxHeap": "value",
            "maxHeapBytes": 0,
            "heapUtilization": "value",
            "availableProcessors": 0,
            "processorLoadAverage": 0.0,
            "totalThreads": 0,
            "daemonThreads": 0,
            "uptime": "value",
            "flowFileRepositoryStorageUsage": {},
            "contentRepositoryStorageUsage": [{}],
            "provenanceRepositoryStorageUsage": [{}],
            "garbageCollection": [{}],
            "statsLastRefreshed": "value",
            "versionInfo": {}
        },
        "nodeSnapshots": [{}]
    }
}
Troubleshooting: What if the response is blank ?
- To check that a docker container is running try
docker psYou should see several containers running. If
dracois not running, you can restart the containers as necessary.
Generating Context Data
For the purpose of this tutorial, we must be monitoring a system where the context is periodically being updated. The
dummy IoT Sensors can be used to do this. Open the device monitor page at http://localhost:3000/device/monitor and
unlock a Smart Door and switch on a Smart Lamp. This can be done by selecting an appropriate the command from
the drop-down list and pressing the send button. The stream of measurements coming from the devices can then be seen
on the same page:
Subscribing to Context Changes
Once a dynamic context system is up and running, we need to inform Draco of changes in context.
This is done by making a POST request to the /v2/subscription endpoint of the Orion Context Broker.
- The
fiware-serviceandfiware-servicepathheaders are used to filter the subscription to only listen to measurements from the attached IoT Sensors. - The
idPatternin the request body ensures that Draco will be informed of all context data changes. - The
throttlingvalue defines the rate that changes are sampled.
9 Request:
curl -iX POST \
  'http://localhost:1026/v2/subscriptions' \
  -H 'Content-Type: application/json' \
  -H 'fiware-service: openiot' \
  -H 'fiware-servicepath: /' \
  -d '{
  "description": "Notify Draco of all context changes",
  "subject": {
    "entities": [
      {
        "idPattern": ".*"
      }
    ]
  },
  "notification": {
    "http": {
      "url": "http://draco:5050/v2/notify"
    }
  },
  "throttling": 5
}'
As you can see, the database used to persist context data has no impact on the details of the subscription. It is the same for each database. The response will be 201 - Created.
Multi-Agent - Reading Persisted Data
To read persisted data from the attached databases, please refer to the previous sections of this tutorial.