![]()
Description: This tutorial is an introduction to FIWARE QuantumLeap - a generic enabler which is used to persist context data into a CrateDB database. The tutorial activates the IoT sensors connected in the previous tutorial and persists measurements from those sensors into the database. To retrieve time-based aggregations of such data, users can either use QuantumLeap query API or connect directly to the CrateDB HTTP endpoint. Results are visualised on a graph or via the Grafana time series analytics tool.
The tutorial uses cUrl commands throughout, but is also available as Postman documentation.

Persisting and Querying Time Series Data (CrateDB)
"Forever is composed of nows."
— Emily Dickinson
Previous tutorials have shown how to persist historic context data into a range of databases such as MySQL and PostgreSQL. using Apache Flume and Apache NIFI Furthermore, the Short Term Historic tutorial has introduced the STH-Comet generic enabler for persisting and querying historic context data using a MongoDB database.
FIWARE QuantumLeap is an alternative generic enabler created specifically that offers an API to persist and query time-series database (CrateDB and TimescaleDB as of today), and therefore offers an alternative to the STH-Comet.
CrateDB is a distributed SQL DBMS designed for use with the internet of Things. It is capable of ingesting a large number of data points per second and can be queried in real-time. The database is designed for the execution of complex queries such as geospatial and time series data. Retrieval of this historic context data allows for the creation of graphs and dashboards displaying trends over time.
TimescaleDB scales PostgreSQL for time-series data via automatic partitioning across time and space (partitioning key), yet retains the standard PostgreSQL interface. In other words, TimescaleDB exposes what look like regular tables, but are actually only an abstraction (or a virtual view) of many individual tables comprising the actual data. In combination with PostGIS extension can support geo-timeseries.
A summary of the differences can be seen below:
| QuantumLeap | STH-Comet |
|---|---|
| Offers an NGSI v2 interface for notifications | Offers an NGSI v1 interface for notifications |
| Persists Data to CrateDB or TimescaleDB database | Persists Data to MongoDB database |
| Offers its own HTTP endpoint for queries (currently for CrateDB), but you can also query CrateDB and TimescaleDB | Offers its own HTTP endpoint for queries, you can also query MongoDB directly |
| QuantumLeap supports complex data queries (thanks to CrateDB and TimescaleDB) | STH-Comet offers a limited set of queries |
| QuantumLeap leverage two natives distributed and scalable SQL DBMS | MongoDB is a document based NoSQL database |
| QuantumLeap's API is documented in OpenAPI here | STH-Comet's API is explained in its docs here |
Further details about the differences between the underlying database engines can be found here.
Analyzing time series data
The appropriate use of time series data analysis will depend on your use case and the reliability of the data measurements you receive. Time series data analysis can be used to answer questions such as:
- What was the maximum measurement of a device within a given time period?
- What was the average measurement of a device within a given time period?
- What was the sum of the measurements sent by a device within a given time period?
It can also be used to reduce the significance of each individual data point to exclude outliers by smoothing.
Grafana
Grafana is an open source software for time series analytics tool which will be used during this
tutorial. It integrates with a variety of time-series databases including CrateDB and TimescaleDB. It is
available licensed under the Apache License 2.0. More information can be found at https://grafana.com/.
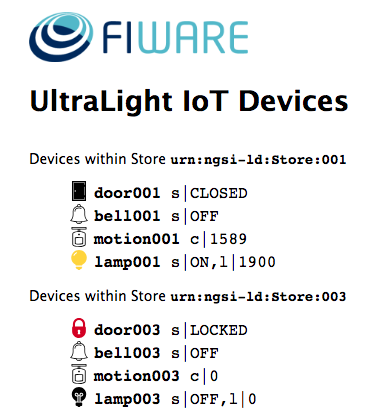
Device Monitor
For the purpose of this tutorial, a series of dummy IoT devices have been created, which will be attached to the context
broker. Details of the architecture and protocol used can be found in the IoT Sensors tutorial. The
state of each device can be seen on the UltraLight device monitor web page found at:
http://localhost:3000/device/monitor
Device History
Once QuantumLeap has started aggregating data, the historical state of each device can be seen on the device history
web page found at: http://localhost:3000/device/history/urn:ngsi-ld:Store:001.
Architecture
This application builds on the components and dummy IoT devices created in previous tutorials. It will use three FIWARE components: the Orion Context Broker, the IoT Agent for Ultralight 2.0, and QuantumLeap.
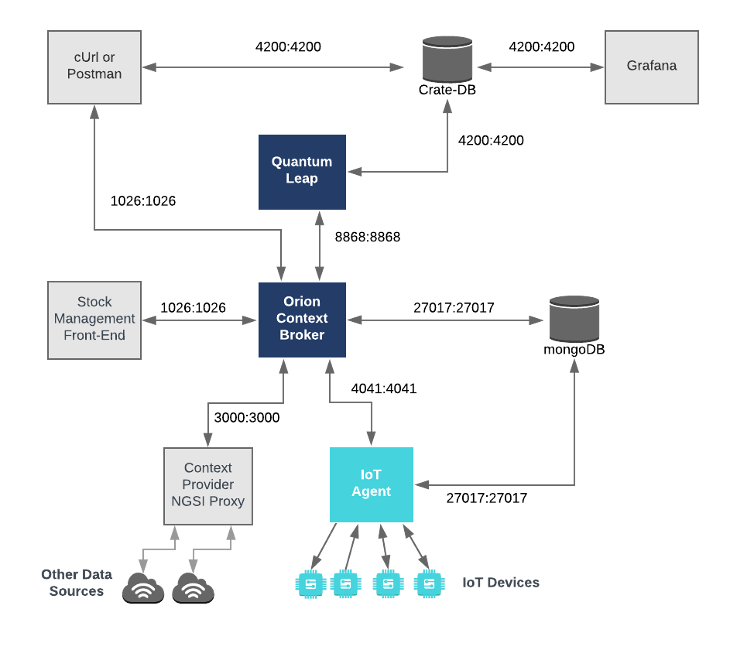
Therefore, the overall architecture will consist of the following elements:
-
The FIWARE Generic Enablers:
- The FIWARE Orion Context Broker which will receive requests using NGSI-v2.
- The FIWARE IoT Agent for Ultralight 2.0 which will receive northbound measurements from the dummy IoT devices in Ultralight 2.0 format and convert them to NGSI-v2 requests for the context broker to alter the state of the context entities.
- FIWARE QuantumLeap subscribed to context changes and persisting them into a CrateDB database.
-
A MongoDB database:
- Used by the Orion Context Broker to hold context data information such as data entities, subscriptions and registrations.
- Used by the IoT Agent to hold device information such as device URLs and Keys.
-
A CrateDB database:
- Used as a data sink to hold time-based historical context data.
- offers an HTTP endpoint to interpret time-based data queries.
-
A Context Provider: - A webserver acting as set of dummy IoT devices using the Ultralight 2.0 protocol running over HTTP. - Note the Stock Management Frontend and Context Provider NGSI proxy are not used in this tutorial.
Since all interactions between the elements are initiated by HTTP requests, the entities can be containerized and run from exposed ports.
The overall architecture can be seen below:
Video: Short-Term History
![]()
Click on the image above to watch a demo of this tutorial persisting context data using QuantumLeap
Start Up
Before you start, you should ensure that you have obtained or built the necessary Docker images locally. Please clone the repository and create the necessary images by running the commands as shown:
#!/bin/bash
git clone https://github.com/FIWARE/tutorials.Time-Series-Data.git
cd tutorials.Time-Series-Data

./services create
Thereafter, all services can be initialized from the command-line by running the services Bash script provided within the repository:
./services start
Note: If you want to clean up and start over again you can do so with the following command:
./services stop
Connecting FIWARE to a CrateDB Database via QuantumLeap
In the configuration, QuantumLeap listens to NGSI v2 notifications on port 8668 and persists historic context data
to the CrateDB. CrateDB is accessible using port 4200 and can either be queried directly or attached to the
Grafana analytics tool. The rest of the system providing the context data has been described in previous tutorials.
CrateDB Database Server Configuration
crate-db:
    image: crate:4.1.4
    hostname: crate-db
    ports:
        - '4200:4200'
        - '4300:4300'
    command:
        crate -Cauth.host_based.enabled=false  -Ccluster.name=democluster -Chttp.cors.enabled=true
        -Chttp.cors.allow-origin="*"
    environment:
        - CRATE_HEAP_SIZE=2g
If CrateDB exits immediately with a
max virtual memory areas vm.max_map_count [65530] is too low, increase to at least [262144] error, this can be fixed
by running the sudo sysctl -w vm.max_map_count=262144 command on the host machine. For further information look within
the CrateDB documentation
and Docker
troubleshooting guide.
QuantumLeap Configuration
quantumleap:
    image: smartsdk/quantumleap
    hostname: quantumleap
    ports:
        - '8668:8668'
    depends_on:
        - crate-db
    environment:
        - CRATE_HOST=crate-db
        - LOGLEVEL=DEBUG
Grafana Configuration
grafana:
    image: grafana/grafana
    depends_on:
        - crate-db
    ports:
        - '3003:3000'
    environment:
        - GF_INSTALL_PLUGINS=https://github.com/orchestracities/grafana-map-plugin/archive/master.zip;grafana-map-plugin,grafana-clock-panel,grafana-worldmap-panel
The quantumleap container is listening on one port:
- The Operations for port for QuantumLeap -
8668is where the service will be listening for notifications from the Orion context broker and where users can query data from.
The CRATE_HOST environment variable defines the location where the data will be persisted.
The cratedb container is listening on two ports:
- The Admin UI is available on port
4200. - The transport protocol is available on
port 4300.
The grafana container has connected up port 3000 internally with port 3003 externally. This is because the Grafana
UI is usually available on port 3000, but this port has already been taken by the dummy devices UI so it has been
shifted to another port. The Grafana Environment variables are described within their own
documentation. The configuration ensures we will be able to
connect to the CrateDB database later on in the tutorial. The configuration also imports a custom map plugin that
helps you in displaying NGSI v2 entities over a map.
Generating Context Data
For the purpose of this tutorial, we must be monitoring a system where the context is periodically being updated. The
dummy IoT Sensors can be used to do this. Open the device monitor page at http://localhost:3000/device/monitor and
unlock a Smart Door and switch on a Smart Lamp. This can be done by selecting an appropriate command from the
drop-down list and pressing the send button. The stream of measurements coming from the devices can then be seen on
the same page:
Setting up Subscriptions
Once a dynamic context system is up and running, we need to inform QuantumLeap directly of changes in context. As
expected this is done using the subscription mechanism of the Orion Context Broker. The attrsFormat=legacy
attribute is not required since QuantumLeap accepts NGSI v2 notifications directly.
Subscriptions will be covered in the next subsections. More details about subscriptions can be found in previous tutorials or in the subscriptions section of QuantumLeap docs.
Aggregate Motion Sensor Count Events
The rate of change of the Motion Sensor is driven by events in the real-world. We need to receive every event to be able to aggregate the results.
This is done by making a POST request to the /v2/subscriptions endpoint of the Orion Context Broker.
- The
fiware-serviceandfiware-servicepathheaders are used to filter the subscription to only listen to measurements from the attached IoT Sensors. - The
idPatternin the request body ensures that QuantumLeap will be informed of all Motion Sensor data changes. - The
notificationURL must match the exposed port.
The metadata attribute ensures that the time_index column within the CrateDB database will match the data found
within the MongoDB database used by the Orion Context Broker rather than using the creation time of the record
within the CrateDB itself.
1 Request:
curl -iX POST \
  'http://localhost:1026/v2/subscriptions/' \
  -H 'Content-Type: application/json' \
  -H 'fiware-service: openiot' \
  -H 'fiware-servicepath: /' \
  -d '{
  "description": "Notify QuantumLeap of count changes of any Motion Sensor",
  "subject": {
    "entities": [
      {
        "idPattern": "Motion.*"
      }
    ],
    "condition": {
      "attrs": [
        "count"
      ]
    }
  },
  "notification": {
    "http": {
      "url": "http://quantumleap:8668/v2/notify"
    },
    "attrs": [
      "count"
    ],
    "metadata": ["dateCreated", "dateModified"]
  }
}'
Sample Lamp Luminosity
The luminosity of the Smart Lamp is constantly changing, we only need to sample the values to be able to work out relevant statistics such as minimum and maximum values and rates of change.
This is done by making a POST request to the /v2/subscriptions endpoint of the Orion Context Broker and including
the throttling attribute in the request body.
- The
fiware-serviceandfiware-servicepathheaders are used to filter the subscription to only listen to measurements from the attached IoT Sensors. - The
idPatternin the request body ensures that QuantumLeap will be informed of all Motion Sensor data changes. - The
notificationURL must match the exposed port. - The
throttlingvalue defines the rate that changes are sampled.
The metadata attribute ensures that the time_index column within the CrateDB database will match the data found
within the MongoDB database used by the Orion Context Broker rather than using the creation time of the record
within the CrateDB itself.
2 Request:
curl -iX POST \
  'http://localhost:1026/v2/subscriptions/' \
  -H 'Content-Type: application/json' \
  -H 'fiware-service: openiot' \
  -H 'fiware-servicepath: /' \
  -d '{
  "description": "Notify QuantumLeap on luminosity changes on any Lamp",
  "subject": {
    "entities": [
      {
        "idPattern": "Lamp.*"
      }
    ],
    "condition": {
      "attrs": [
        "luminosity",
        "location"
      ]
    }
  },
  "notification": {
    "http": {
      "url": "http://quantumleap:8668/v2/notify"
    },
    "attrs": [
      "luminosity", "location"
    ],
    "metadata": ["dateCreated", "dateModified"]
  },
  "throttling": 1
}'
Checking Subscriptions for QuantumLeap
Before anything, check the subscriptions you created in steps 1 and 2 are working (i.e., at least one notification for each was sent).
3 Request:
curl -X GET \
  'http://localhost:1026/v2/subscriptions/' \
  -H 'fiware-service: openiot' \
  -H 'fiware-servicepath: /'
Response:
Tip: Use jq to format the JSON responses in this tutorial. Pipe the result by appending
| jq '.'
[
    {
        "id": "64b6bc0dd439ec09a007ee19",
        "description": "Notify QuantumLeap of all Motion Sensor count changes",
        "status": "active",
        "subject": {
            "entities": [
                {
                    "idPattern": "Motion.*"
                }
            ],
            "condition": {
                "attrs": ["count"],
                "notifyOnMetadataChange": true
            }
        },
        "notification": {
            "timesSent": 48,
            "lastNotification": "2023-07-18T16:23:21.000Z",
            "attrs": ["count"],
            "onlyChangedAttrs": false,
            "attrsFormat": "normalized",
            "http": {
                "url": "http://quantumleap:8668/v2/notify"
            },
            "metadata": ["dateCreated", "dateModified"],
            "lastSuccess": "2023-07-18T16:23:22.000Z",
            "lastSuccessCode": 200,
            "covered": false
        }
    },
    {
        "id": "64b6bc11d439ec09a007ee1a",
        "description": "Notify Quantum Leap to sample Lamp changes every five seconds",
        "status": "active",
        "subject": {
            "entities": [
                {
                    "idPattern": "Lamp.*"
                }
            ],
            "condition": {
                "attrs": ["luminosity", "location"],
                "notifyOnMetadataChange": true
            }
        },
        "notification": {
            "timesSent": 21,
            "lastNotification": "2023-07-18T16:23:19.000Z",
            "attrs": ["luminosity", "location"],
            "onlyChangedAttrs": false,
            "attrsFormat": "normalized",
            "http": {
                "url": "http://quantumleap:8668/v2/notify"
            },
            "metadata": ["dateCreated", "dateModified"],
            "lastSuccess": "2023-07-18T16:23:20.000Z",
            "lastSuccessCode": 200,
            "covered": false
        },
        "throttling": 5
    }
]
Time Series Data Queries (QuantumLeap API)
QuantumLeap offers an API wrapping CrateDB backend so you can also perform multiple types of queries. The
documentation of the API is here. Mind the versions. If you have
access to your quantumleap container (e.g. it is running in localhost or port-forwarding to it), you can navigate
its API via http://localhost:8668/v2/ui.
QuantumLeap API - List the first N Sampled Values
Now, to check QuantumLeap is persisting values, let's get started with our first query. This example shows the first 3
sampled luminosity values from Lamp:001.
Note the use of Fiware-Service and Fiware-ServicePath headers. These are required only when data are pushed to orion
using such headers (in multitenancy scenarios). Failing to align these headers will result in no data being returned.
4 Request:
curl -X GET \
  'http://localhost:8668/v2/entities/Lamp:001/attrs/luminosity?limit=3' \
  -H 'Accept: application/json' \
  -H 'Fiware-Service: openiot' \
  -H 'Fiware-ServicePath: /'
Response:
{
    "attrName": "luminosity",
    "entityId": "Lamp:001",
    "entityType": "Lamp",
    "index": ["2023-07-18T16:21:37.915+00:00", "2023-07-18T16:21:42.800+00:00", "2023-07-18T16:21:47.851+00:00"],
    "values": [1992, 1996, 1995]
}
QuantumLeap API - List N Sampled Values at an Offset
This example shows the fourth, fifth and sixth sampled count values of Motion:001.
5 Request:
curl -X GET \
  'http://localhost:8668/v2/entities/Motion:001/attrs/count?offset=3&limit=3' \
  -H 'Accept: application/json' \
  -H 'Fiware-Service: openiot' \
  -H 'Fiware-ServicePath: /'
Response:
{
    "attrName": "count",
    "entityId": "Motion:001",
    "entityType": "Motion",
    "index": ["2023-07-18T16:21:39.869+00:00", "2023-07-18T16:21:40.930+00:00", "2023-07-18T16:21:41.857+00:00"],
    "values": [0, 1, 0]
}
QuantumLeap API - List the latest N Sampled Values
This example shows the latest three sampled count values from Motion:001.
6 Request:
curl -X GET \
  'http://localhost:8668/v2/entities/Motion:001/attrs/count?lastN=3' \
  -H 'Accept: application/json' \
  -H 'Fiware-Service: openiot' \
  -H 'Fiware-ServicePath: /'
Response:
{
    "attrName": "count",
    "entityId": "Motion:001",
    "entityType": "Motion",
    "index": ["2023-07-18T16:25:28.221+00:00", "2023-07-18T16:25:29.169+00:00", "2023-07-18T16:25:30.186+00:00"],
    "values": [1, 0, 1]
}
QuantumLeap API - List the Sum of values grouped by a time period
This example shows last 3 total count values of Motion:001 over each minute.
You need QuantumLeap version >= 0.4.1. You can check your version with a simple GET like:
curl -X GET \
  'http://localhost:8668/version' \
  -H 'Accept: application/json'
7 Request:
curl -X GET \
  'http://localhost:8668/v2/entities/Motion:001/attrs/count?aggrMethod=count&aggrPeriod=minute&lastN=3' \
  -H 'Accept: application/json' \
  -H 'Fiware-Service: openiot' \
  -H 'Fiware-ServicePath: /'
Response:
{
    "attrName": "count",
    "entityId": "Motion:001",
    "entityType": "Motion",
    "index": ["2023-07-18T16:23:00.000+00:00", "2023-07-18T16:24:00.000+00:00", "2023-07-18T16:25:00.000+00:00"],
    "values": [20, 14, 21]
}
QuantumLeap API - List the Minimum Values grouped by a Time Period
This example shows minimum luminosity values from Lamp:001 over each minute.
You need QuantumLeap version >= 0.4.1. You can check your version with a simple GET like:
curl -X GET \
  'http://localhost:8668/version' \
  -H 'Accept: application/json'
8 Request:
curl -X GET \
  'http://localhost:8668/v2/entities/Lamp:001/attrs/luminosity?aggrMethod=min&aggrPeriod=minute&lastN=3' \
  -H 'Accept: application/json' \
  -H 'Fiware-Service: openiot' \
  -H 'Fiware-ServicePath: /'
Response:
  -H 'Fiware-ServicePath: /'
{
  "attrName": "luminosity",
  "entityId": "Lamp:001",
  "entityType": "Lamp",
  "index": [
    "2023-07-18T16:24:00.000+00:00",
    "2023-07-18T16:25:00.000+00:00",
    "2023-07-18T16:26:00.000+00:00"
  ],
  "values": [
    1590,
    1729,
    1886
  ]
}
QuantumLeap API - List the Maximum Value over a Time Period
This example shows maximum luminosity value of Lamp:001 that occurred between from 2018-06-27T09:00:00 to
2018-06-30T23:59:59.
9 Request:
<current_time>needs to be replaced with2023-08-03T12:00:00.000Zin ISO8601 format.
<previous_time>needs to be replaced with2023-08-03T11:55:00.000Zin ISO8601 format.
curl -X GET \
  'http://localhost:8668/v2/entities/Lamp:001/attrs/luminosity?aggrMethod=max&fromDate=<previous_time>&toDate=<current_time>' \
  -H 'Accept: application/json' \
  -H 'Fiware-Service: openiot' \
  -H 'Fiware-ServicePath: /'
Response:
{
    "attrName": "luminosity",
    "entityId": "Lamp:001",
    "entityType": "Lamp",
    "index": [],
    "values": [1999]
}
QuantumLeap API - List the latest N Sampled Values of Devices near a Point
This example shows the latest four sampled luminosity values of lamps that are within a 5 km radius from
52°33'16.9"N 13°23'55.0"E (Bornholmer Straße 65, Berlin, Germany). If you have turned on all the lamps available on
the device monitor page, you should be able to see data for Lamp:001 and Lamp:004.
Note: Geographical queries are only available starting from version
0.5of QuantumLeap which implements the full set of queries detailed in the Geographical Queries section of the NGSI v2 specification.
10 Request:
curl -X GET \
  'http://localhost:8668/v2/types/Lamp/attrs/luminosity?lastN=4&georel=near;maxDistance:5000&geometry=point&coords=52.5547,13.3986' \
  -H 'Accept: application/json' \
  -H 'Fiware-Service: openiot' \
  -H 'Fiware-ServicePath: /'
Response:
{
    "data": {
        "attrName": "luminosity",
        "entities": [
            {
                "entityId": "Lamp:001",
                "index": ["2018-12-13T16:35:58.284", "2018-12-13T16:36:58.216"],
                "values": [999, 999]
            },
            {
                "entityId": "Lamp:004",
                "index": ["2018-12-13T16:35:04.351", "2018-12-13T16:36:04.282"],
                "values": [948, 948]
            }
        ],
        "entityType": "Lamp"
    }
}
QuantumLeap API - List the latest N Sampled Values of Devices in an Area
This example shows the latest four sampled luminosity values of lamps that are inside a square of side 200 m centred
at 52°33'16.9"N 13°23'55.0"E (Bornholmer Straße 65, Berlin, Germany). Even if you have turned on all the lamps
available on the device monitor page, you should only see data for Lamp:001.
Note: Geographical queries are only available starting from version
0.5of QuantumLeap which implements the full set of queries detailed in the Geographical Queries section of the NGSI v2 specification.
11 Request:
curl -X GET \
  'http://localhost:8668/v2/types/Lamp/attrs/luminosity?lastN=4&georel=coveredBy&geometry=polygon&coords=52.5537,13.3996;52.5557,13.3996;52.5557,13.3976;52.5537,13.3976;52.5537,13.3996' \
  -H 'Accept: application/json' \
  -H 'Fiware-Service: openiot' \
  -H 'Fiware-ServicePath: /'
Response:
{
    "data": {
        "attrName": "luminosity",
        "entities": [
            {
                "entityId": "Lamp:001",
                "index": [
                    "2018-12-13T17:08:56.041",
                    "2018-12-13T17:09:55.976",
                    "2018-12-13T17:10:55.907",
                    "2018-12-13T17:11:55.833"
                ],
                "values": [999, 999, 999, 999]
            }
        ],
        "entityType": "Lamp"
    }
}
Time Series Data Queries (CrateDB API)
CrateDB offers an HTTP Endpoint that can be
used to submit SQL queries. The endpoint is accessible under <servername:port>/_sql.
SQL statements are sent as the body of POST requests in JSON format, where the SQL statement is the value of the stmt
attribute.
When to query CrateDB and when QuantumLeap?. As a rule of thumb, prefer working always with QuantumLeap for the following reasons:
- Your experience will be closer to FIWARE NGSI APIs like Orion's.
- Your application will not be tied to CrateDB's specifics nor QuantumLeap's implementation details, which could change and break your app.
- QuantumLeap can be easily extended to other backends and your app will get compatibility for free.
- If your deployment is distributed, you won't need to expose the ports of your database to the outside.
If you are sure your query is not supported by QuantumLeap, you may have to end up querying CrateDB, however, please open an issue in QuantumLeap's GitHub repository so the team is aware.
CrateDB API - Checking Data persistence
Another way to see if data are being persisted is to check if a table_schema has been created. This can be done by
making a request to the CrateDB HTTP endpoint as shown:
12 Request:
curl -iX POST \
  'http://localhost:4200/_sql' \
  -H 'Content-Type: application/json' \
  -d '{"stmt":"SHOW SCHEMAS"}'
Response:
{
    "cols": ["schema_name"],
    "rows": [["blob"], ["doc"], ["information_schema"], ["mtopeniot"], ["pg_catalog"], ["sys"]],
    "rowcount": 6,
    "duration": 15.559625
}
Schema names are formed with the mt prefix followed by fiware-service header in lower case. The IoT Agent is
forwarding measurements from the dummy IoT devices, with the FIWARE-Service header openiot. These are being
persisted under the mtopeniot schema.
If the mtopeniot does not exist, then the subscription to QuantumLeap has not been set up correctly. Check that
the subscription exists, and has been configured to send data to the correct location.
QuantumLeap will persist data into separate tables within the CrateDB database based on the entity type. Table
names are formed with the et prefix and the entity type name in lowercase.
13 Request:
curl -X POST \
  'http://localhost:4200/_sql' \
  -H 'Content-Type: application/json' \
  -d '{"stmt":"SHOW TABLES"}'
Response:
{
    "cols": ["table_name"],
    "rows": [["etlamp"], ["etmotion"], ["md_ets_metadata"]],
    "rowcount": 3,
    "duration": 15.263458
}
The response shows that both Motion Sensor data and Smart Lamp data are being persisted in the database.
CrateDB API - List the first N Sampled Values
The SQL statement uses ORDER BY and LIMIT clauses to sort the data. More details can be found under within the
CrateDB documentation
14 Request:
curl -iX POST \
  'http://localhost:4200/_sql' \
  -H 'Content-Type: application/json' \
  -d '{"stmt":"SELECT * FROM mtopeniot.etlamp WHERE entity_id = '\''Lamp:001'\'' ORDER BY time_index ASC LIMIT 3"}'
Response:
{
    "cols": [
        "entity_id",
        "entity_type",
        "time_index",
        "fiware_servicepath",
        "__original_ngsi_entity__",
        "instanceid",
        "luminosity",
        "location",
        "location_centroid"
    ],
    "rows": [
        [
            "Lamp:001",
            "Lamp",
            1689697297915,
            "/",
            null,
            "urn:ngsi-ld:1cc3a7d5-86cb-447c-b691-95d8dd138981",
            1992,
            { "coordinates": [52.5547, 13.3986], "type": "Point" },
            [52.5547, 13.3986]
        ],
        [
            "Lamp:001",
            "Lamp",
            1689697302800,
            "/",
            null,
            "urn:ngsi-ld:0bf5d692-48dc-49ad-8f0b-bdd5e0e4e2b9",
            1996,
            { "coordinates": [52.5547, 13.3986], "type": "Point" },
            [52.5547, 13.3986]
        ],
        [
            "Lamp:001",
            "Lamp",
            1689697307851,
            "/",
            null,
            "urn:ngsi-ld:a830b61e-8947-4fce-986c-6225db1622d1",
            1995,
            { "coordinates": [52.5547, 13.3986], "type": "Point" },
            [52.5547, 13.3986]
        ]
    ],
    "rowcount": 3,
    "duration": 131.47903
}
CrateDB API - List N Sampled Values at an Offset
The SQL statement uses an OFFSET clause to retrieve the required rows. More details can be found under within the
CrateDB documentation.
15 Request:
curl -iX POST \
  'http://localhost:4200/_sql' \
  -H 'Content-Type: application/json' \
  -d '{"stmt":"SELECT * FROM mtopeniot.etmotion WHERE entity_id = '\''Motion:001'\'' order by time_index ASC LIMIT 3 OFFSET 3"}'
Response:
{
    "cols": [
        "entity_id",
        "entity_type",
        "time_index",
        "fiware_servicepath",
        "__original_ngsi_entity__",
        "instanceid",
        "count"
    ],
    "rows": [
        ["Motion:001", "Motion", 1689697299869, "/", null, "urn:ngsi-ld:6232dc49-8a03-4471-8d49-266d2f5b4234", 0],
        ["Motion:001", "Motion", 1689697300930, "/", null, "urn:ngsi-ld:65d82c77-01c4-483b-bda1-7496feb7bd0f", 1],
        ["Motion:001", "Motion", 1689697301857, "/", null, "urn:ngsi-ld:90f2db3d-1cb0-48e4-ab8c-c71e4ceac1d3", 0]
    ],
    "rowcount": 3,
    "duration": 301.9434
}
CrateDB API - List the latest N Sampled Values
The SQL statement uses an ORDER BY ... DESC clause combined with a LIMIT clause to retrieve the last N rows. More
details can be found under within the CrateDB
documentation.
16 Request:
curl -iX POST \
  'http://localhost:4200/_sql' \
  -H 'Content-Type: application/json' \
  -d '{"stmt":"SELECT * FROM mtopeniot.etmotion WHERE entity_id = '\''Motion:001'\''  ORDER BY time_index DESC LIMIT 3"}'
Response:
{
    "cols": [
        "entity_id",
        "entity_type",
        "time_index",
        "fiware_servicepath",
        "__original_ngsi_entity__",
        "instanceid",
        "count"
    ],
    "rows": [
        ["Motion:001", "Motion", 1689699097452, "/", null, "urn:ngsi-ld:99910d16-b388-4216-ada9-4c2df8feef8a", 0],
        ["Motion:001", "Motion", 1689699095481, "/", null, "urn:ngsi-ld:070ef58d-36b5-46b1-a9ef-72897972718e", 1],
        ["Motion:001", "Motion", 1689699093507, "/", null, "urn:ngsi-ld:7bf0f277-0203-4912-ba5b-2555bafd661b", 0]
    ],
    "rowcount": 3,
    "duration": 783.8505
}
CrateDB API - List the Sum of values grouped by a time period
The SQL statement uses a SUM function and GROUP BY clause to retrieve the relevant data. CrateDB offers a range
of
Date-Time Functions
to truncate and convert the timestamps into data which can be grouped.
17 Request:
curl -iX POST \
  'http://localhost:4200/_sql' \
  -H 'Content-Type: application/json' \
  -d '{"stmt":"SELECT DATE_FORMAT (DATE_TRUNC ('\''minute'\'', time_index)) AS minute, SUM (count) AS sum FROM mtopeniot.etmotion WHERE entity_id = '\''Motion:001'\'' GROUP BY minute LIMIT 3"}'
Response:
{
    "cols": ["minute", "sum"],
    "rows": [
        ["2023-07-18T16:26:00.000000Z", 11],
        ["2023-07-18T16:36:00.000000Z", 11],
        ["2023-07-18T16:29:00.000000Z", 14]
    ],
    "rowcount": 3,
    "duration": 867.4263
}
CrateDB API - List the Minimum Values grouped by a Time Period
The SQL statement uses a MIN function and GROUP BY clause to retrieve the relevant data. CrateDB offers a range
of
Date-Time Functions
to truncate and convert the timestamps into data which can be grouped.
18 Request:
curl -iX POST \
  'http://localhost:4200/_sql' \
  -H 'Content-Type: application/json' \
  -d '{"stmt":"SELECT DATE_FORMAT (DATE_TRUNC ('\''minute'\'', time_index)) AS minute, MIN (luminosity) AS min FROM mtopeniot.etlamp WHERE entity_id = '\''Lamp:001'\'' GROUP BY minute"}'
Response:
{
    "cols":["minute","min"],
    "rows":[
        ["2023-07-18T16:26:00.000000Z",1834],
        ["2023-07-18T16:36:00.000000Z",1722],
        ["2023-07-18T16:29:00.000000Z",1881],
        ["2023-07-18T16:32:00.000000Z",1866],
        ["2023-07-18T16:23:00.000000Z",1684],
        ... etc
    ],
    "rowcount":33,
    "duration":46.888416
}
CrateDB API - List the Maximum Value over a Time Period
The SQL statement uses a MAX function and a WHERE clause to retrieve the relevant data. CrateDB offers a range
of Aggregate Functions to
aggregate data in different ways.
19 Request:
<current_time>needs to be replaced with2023-08-03T12:00:00in ISO8601 format.
<previous_time>needs to be replaced with2023-08-03T11:55:00in ISO8601 format.
curl -iX POST \
  'http://localhost:4200/_sql' \
  -H 'Content-Type: application/json' \
  -d '{"stmt":"SELECT MAX(luminosity) AS max FROM mtopeniot.etlamp WHERE entity_id = '\''Lamp:001'\'' and time_index >= '\''<previous_time>'\'' and time_index < '\''<current_time>'\''"}'
Response:
{
    "cols": ["max"],
    "rows": [[2015]],
    "rowcount": 1,
    "duration": 271.6023
}
Accessing Time Series Data Programmatically
Once the JSON response for a specified time series has been retrieved, displaying the raw data is of little use to an end user. It must be manipulated to be displayed in a bar chart, line graph or table listing. This is not within the domain of QuantumLeap as it not a graphical tool, but can be delegated to a mashup or dashboard component such as Wirecloud or Knowage.
It can also be retrieved and displayed using a third-party graphing tool appropriate to your coding environment - for
example chartjs. An example of this can be found within the history controller in the
Git Repository.
The basic processing consists of two-step - retrieval and attribute mapping, sample code can be seen below:
function readCrateLampLuminosity(id, aggMethod) {
    return new Promise(function (resolve, reject) {
        const sqlStatement =
            "SELECT DATE_FORMAT (DATE_TRUNC ('minute', time_index)) AS minute, " +
            aggMethod +
            '(luminosity) AS ' +
            aggMethod +
            " FROM mtopeniot.etlamp WHERE entity_id = 'Lamp:" +
            id +
            "' GROUP BY minute ORDER BY minute";
        const options = {
            method: 'POST',
            url: crateUrl,
            headers: { 'Content-Type': 'application/json' },
            body: { stmt: sqlStatement },
            json: true
        };
        request(options, (error, response, body) => {
            return error ? reject(error) : resolve(body);
        });
    });
}
function crateToTimeSeries(crateResponse, aggMethod, hexColor) {
    const data = [];
    const labels = [];
    const color = [];

    if (crateResponse && crateResponse.rows && crateResponse.rows.length > 0) {
        _.forEach(crateResponse.rows, (element) => {
            const date = moment(element[0]);
            data.push({ t: date, y: element[1] });
            labels.push(date.format('HH:mm'));
            color.push(hexColor);
        });
    }

    return {
        labels,
        data,
        color
    };
}
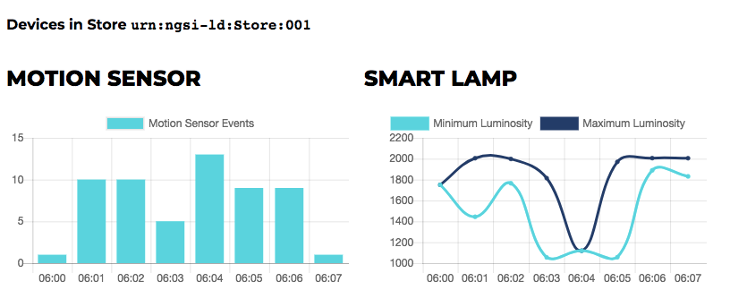
The modified data is then passed to the frontend to be processed by the third-party graphing tool. The result is shown
here: http://localhost:3000/device/history/urn:ngsi-ld:Store:001.
Displaying CrateDB data as a Grafana Dashboard
CrateDB has been chosen as the time-series data sink for QuantumLeap, because, among
many other benefits, it integrates seamlessly with the
Grafana time series analytics tool. Grafana can be used to display the aggregated sensor data -
a full tutorial on building dashboards can be found here. The simplified
instructions below summarize how to connect and display a graph of the Lamp luminosity data.
Logging in
The docker-compose file has started an instance of the Grafana UI listening on port 3003, so the login page can be
found at: http://localhost:3003/login. The default username is admin and the default password is admin.
Configuring a Data Source
After logging in, a PostgreSQL datasource must be set up at http://localhost:3003/datasources with the following
values
- Name
CrateDB - Host
crate-db:5432 - Database
mtopeniot - User
crate - SSL Mode
disable
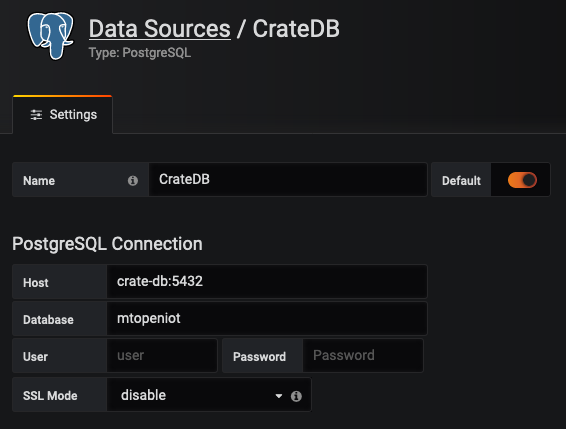
Click on the Save & Test button and make sure it says Database Connection OK.
Configuring a Dashboard
To display a new dashboard, you can either click the + button and select Dashboard or go directly to
http://localhost:3003/dashboard/new?orgId=1. Thereafter, click Add Query.
The following values in bold text need to be placed in the graphing wizard
- Queries to CrateDB (the previously created Data Source)
- FROM etlamp
- Time column time_index
- Metric column entity_id
- Select value column:luminosity
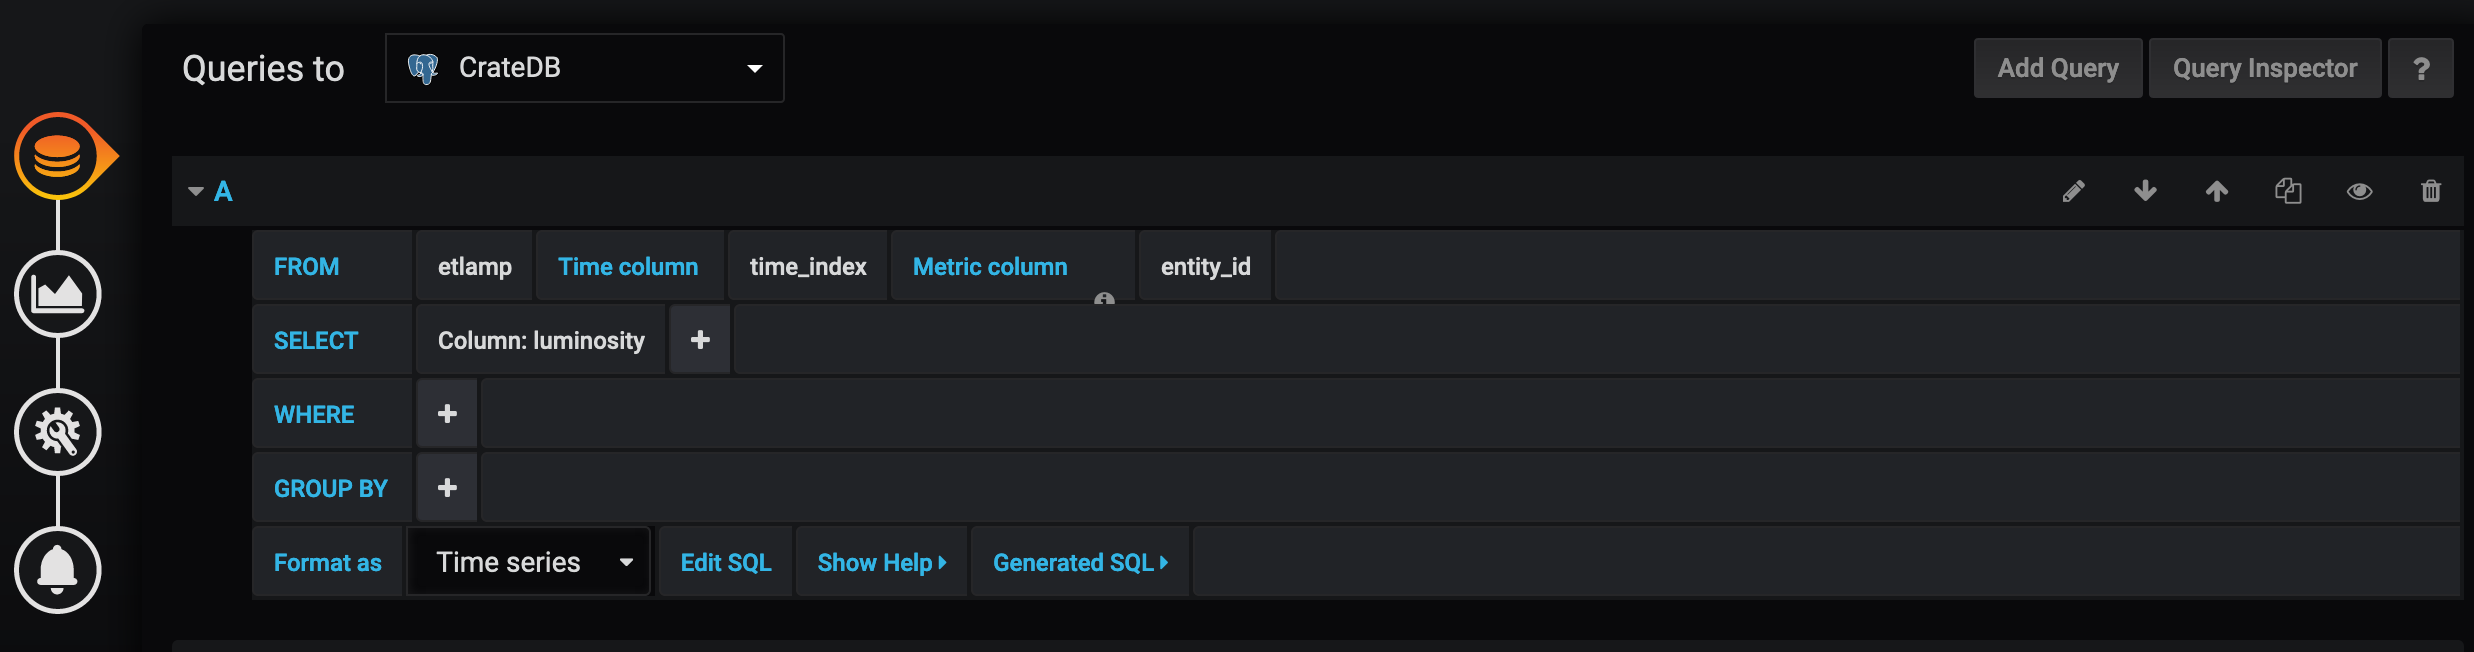
Then click on ESC on your keyboard and you will see a dashboard including the graph you created.
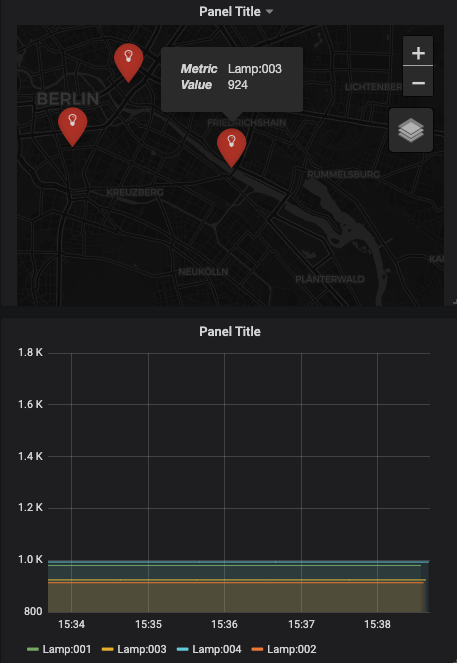
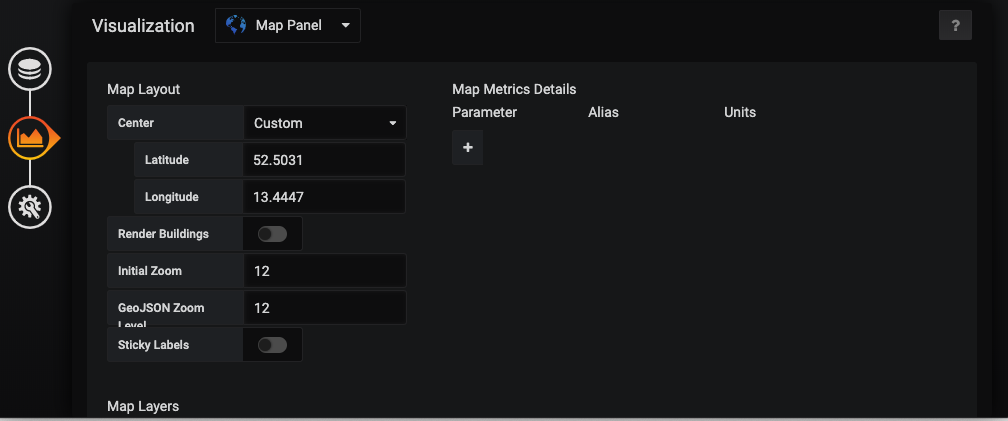
The click on the Add Panel button and select Choose Visualisation and pick Map panel.
In the map layout options set the following values:
- Center: custom
- Latitude: 52.5031
- Longitude: 13.4447
- Initial Zoom: 12
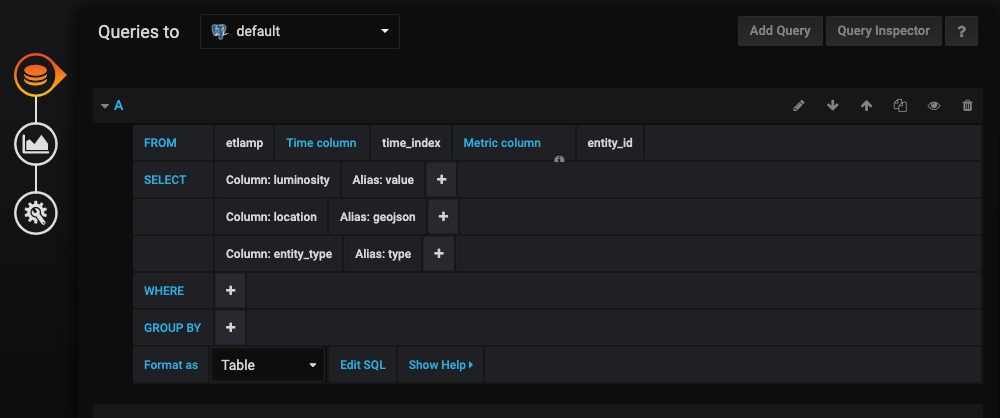
Click on Queries tab on the left and set as follows:
- Format as: Table
- FROM etlamp
- Time column time_index
- Metric column entity_id
- Select value
- column:luminosity alias:value
- column:location alias:geojson
- column:entity_type alias:type
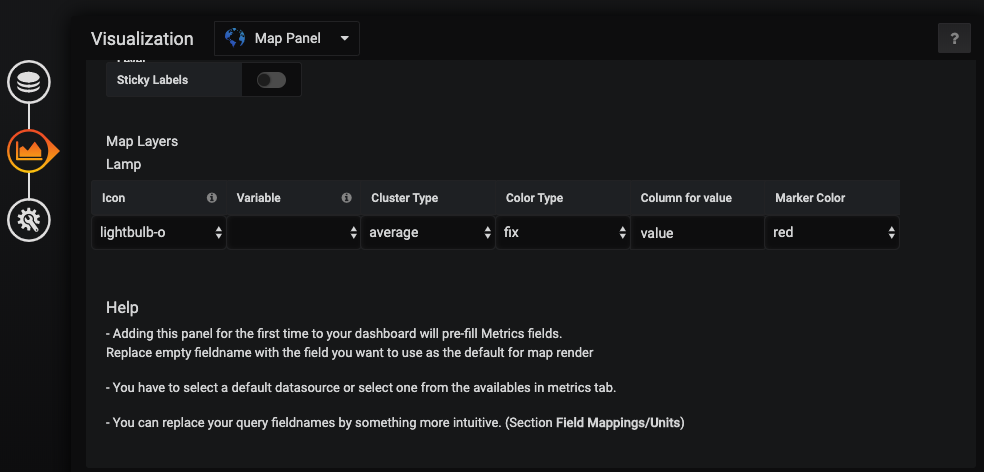
Click on Visualisation tab on the left and set as follows:
- Map Layers:
- Lamp:
- Icon: lightbulb-o
- ClusterType: average
- ColorType: fix
- Column for value: value
- Maker color: red
- Lamp:
The final result can be seen below: